Choosing the Best Trend Indicator for Intraday Trading Costs
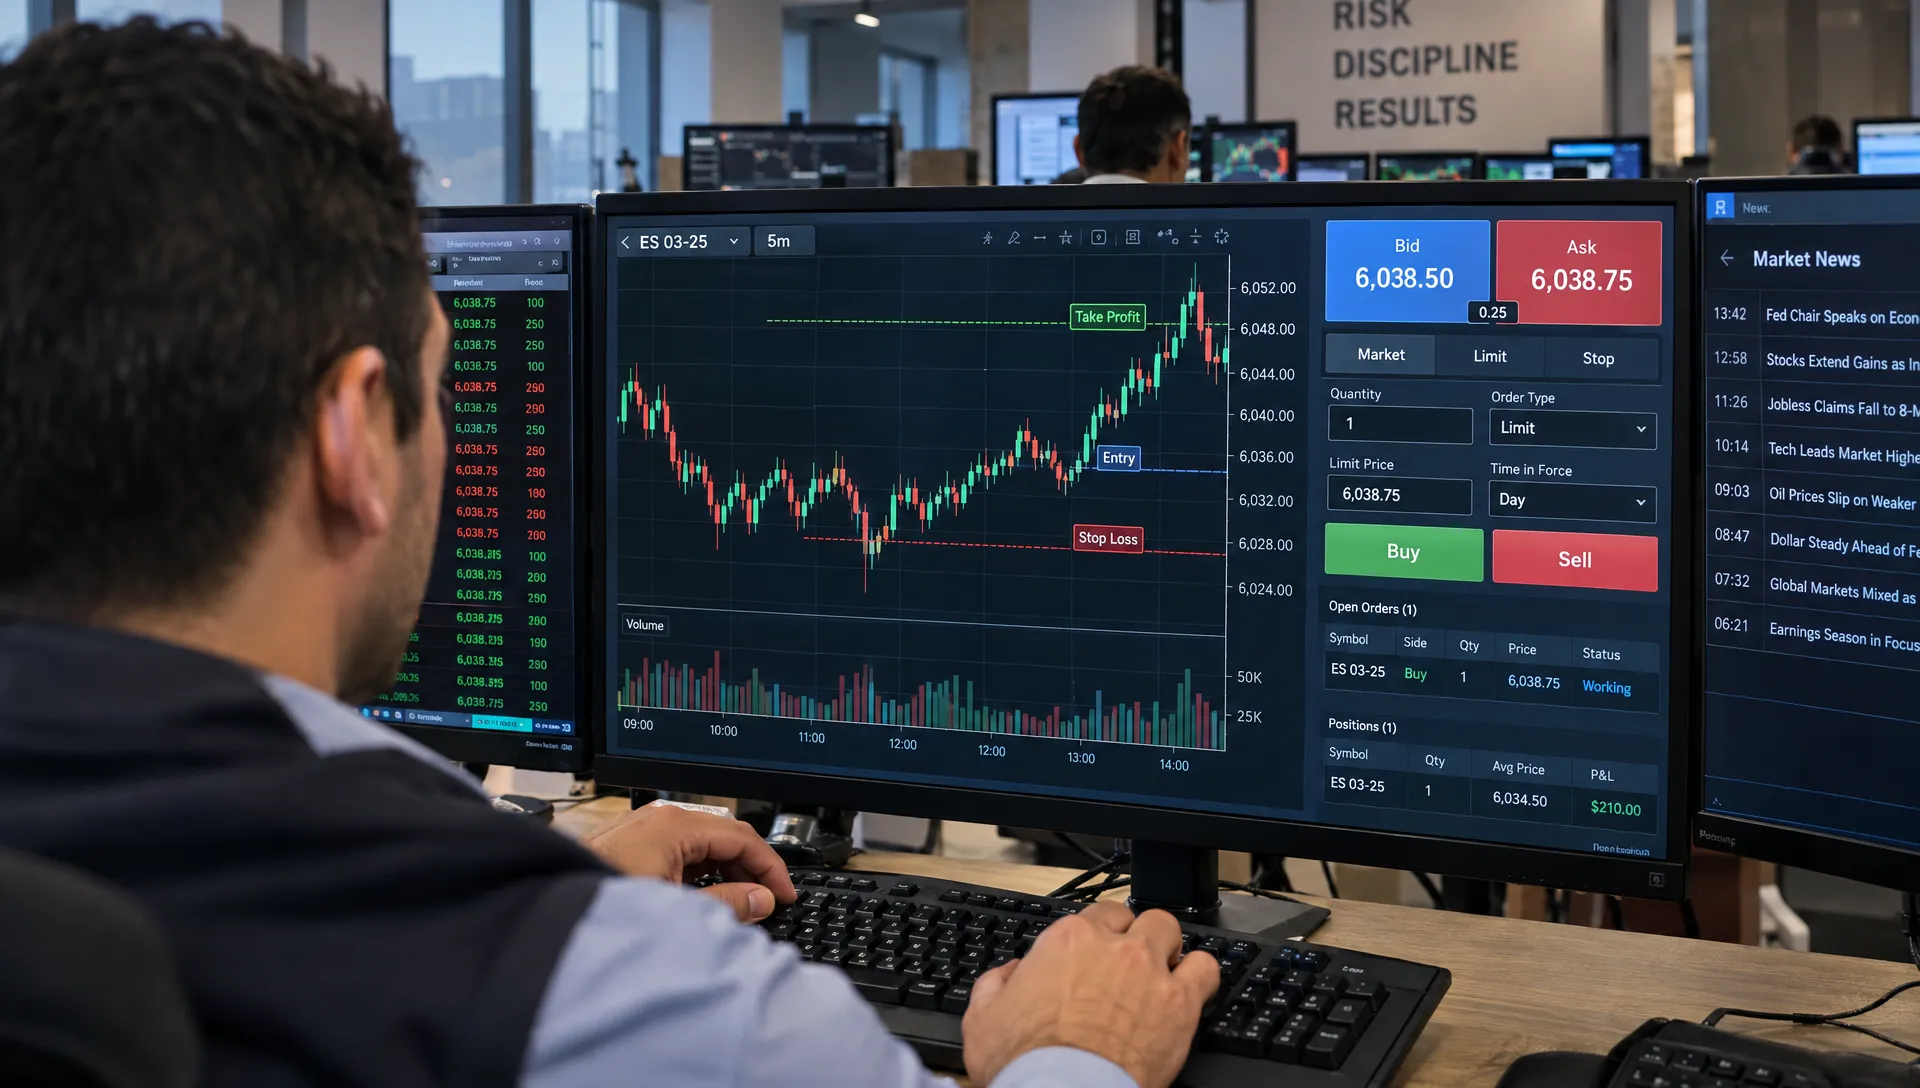
The best trend indicator for intraday trading is the one that helps a clearly defined strategy remain profitable after spreads, slippage and other costs. A chart full of accurate-looking signals means little if those signals arrive late, trigger too many trades or depend on fills you cannot realistically obtain.
For an initial test, exponential moving averages (EMAs) provide a straightforward directional framework. VWAP adds session-specific price context, while Supertrend offers volatility-adjusted trend signals. None is universally superior.
The useful comparison is therefore not just which indicator catches the biggest move. It is which approach fits your market, produces executable trades and survives realistic testing.
Start with direction, strength and market conditions
A trend indicator summarizes information already present in price, volume or both. It does not reveal future orders or guarantee that a move will continue.
Separate three jobs before choosing a tool:
- Direction: Is price generally moving higher or lower?
- Strength: Is that movement persistent enough to distinguish it from sideways noise?
- Execution context: Can you enter and exit without costs consuming the expected gain?
Moving averages primarily describe direction. ADX measures trend strength without identifying direction. VWAP describes price relative to a volume-weighted session average.
Market conditions matter just as much. An indicator that stays usefully bullish during a directional morning can repeatedly reverse during an afternoon range. Adding indicators does not automatically solve this problem, especially when they all summarize similar price movements.
How to choose the best trend indicator for intraday trading
Compare indicators by the job they perform, rather than treating every technical tool as an interchangeable buy signal.
| Indicator | Primary job | Useful application | Main limitation |
|---|---|---|---|
| EMA | Smooth price and describe direction | Trend alignment and pullback entries | Lag and repeated crossovers in ranges |
| Session VWAP | Show volume-weighted session price | Intraday directional context | Repeated crossings when price is balanced |
| Supertrend | Apply volatility-adjusted trend bands | Rule-based direction and trailing exits | Reversals during choppy conditions |
| ADX | Measure trend strength | Filter weak directional conditions | Does not indicate bullish or bearish direction |
| RSI | Measure momentum | Support a trend or pullback assessment | Overbought does not necessarily mean a reversal |
EMA: a practical baseline for directional rules
An EMA gives greater weight to recent observations than older ones. Traders commonly examine pairs such as 9 and 21 periods or 20 and 50 periods, but these are starting hypotheses, not proven optimal settings.
Faster averages react sooner and usually produce more signals. Slower averages react later but can reduce minor fluctuations. That trade-off directly affects turnover and transaction costs.
Rather than buying every crossover, test whether the slower EMA is rising and whether price is making progress beyond recent congestion. A crossover inside a narrow range may provide little useful information.
An EMA pair can be the best trend indicator for intraday trading when simplicity makes the rules easier to execute and validate. That is an implementation advantage, not evidence of superior returns.
VWAP: useful context, not an automatic entry
Session VWAP is the volume-weighted average price since the chosen session began. Price holding above a rising VWAP can support a bullish interpretation, but merely touching or crossing the line does not establish an edge.
Its construction matters. A regular-hours stock VWAP differs from one that includes extended-hours trading. For a continuously traded crypto market, the reset time is a convention rather than a universal opening bell.
VWAP can also become less responsive later in a session because more earlier volume is included in the calculation. During balanced trading, price may cross it repeatedly without developing a sustained move.
When evaluating the best trend indicator for intraday trading, use VWAP to answer a specific question: does the intended trade align with session price behavior? Avoid treating every crossing as a fresh opportunity.
Supertrend: volatility-adjusted signals with a cost trade-off
Supertrend uses Average True Range (ATR) to construct bands that determine its displayed trend state. Depending on the implementation, a breach of a band changes that state and generates a reversal signal.
A shorter ATR lookback or smaller multiplier generally makes the indicator more responsive. A wider setting usually produces fewer reversals but can delay exits and increase the distance to a trailing stop.
A 10-period ATR with a multiplier of 3 is one configuration worth testing, not a universal recommendation. Check the platform’s exact calculation and whether signals update before the candle closes.
The most visually appealing setting may simply have matched the recent chart. Compare nearby settings and different market conditions before accepting it.
ADX, RSI and volume: supporting tools with different jobs
Fidelity’s ADX guide distinguishes trend strength from direction. ADX can rise during either an uptrend or a downtrend. Thresholds such as 20 or 25 are conventions to investigate, not boundaries that guarantee a tradable move.
RSI can support momentum analysis, but strong trends can remain overbought or oversold. Automatically shorting an overbought reading can conflict with a trend-following strategy.
Volume confirmation also needs context. For intraday stocks, compare volume with the typical activity for the same time of day rather than assuming opening volume and lunchtime volume are directly comparable.
The best trend indicator for intraday trading does not need three other indicators to repeat its message. Add a filter only when it answers a separate question and improves results outside the development sample.
Calculate trading costs before judging signal quality
A useful starting relationship is:
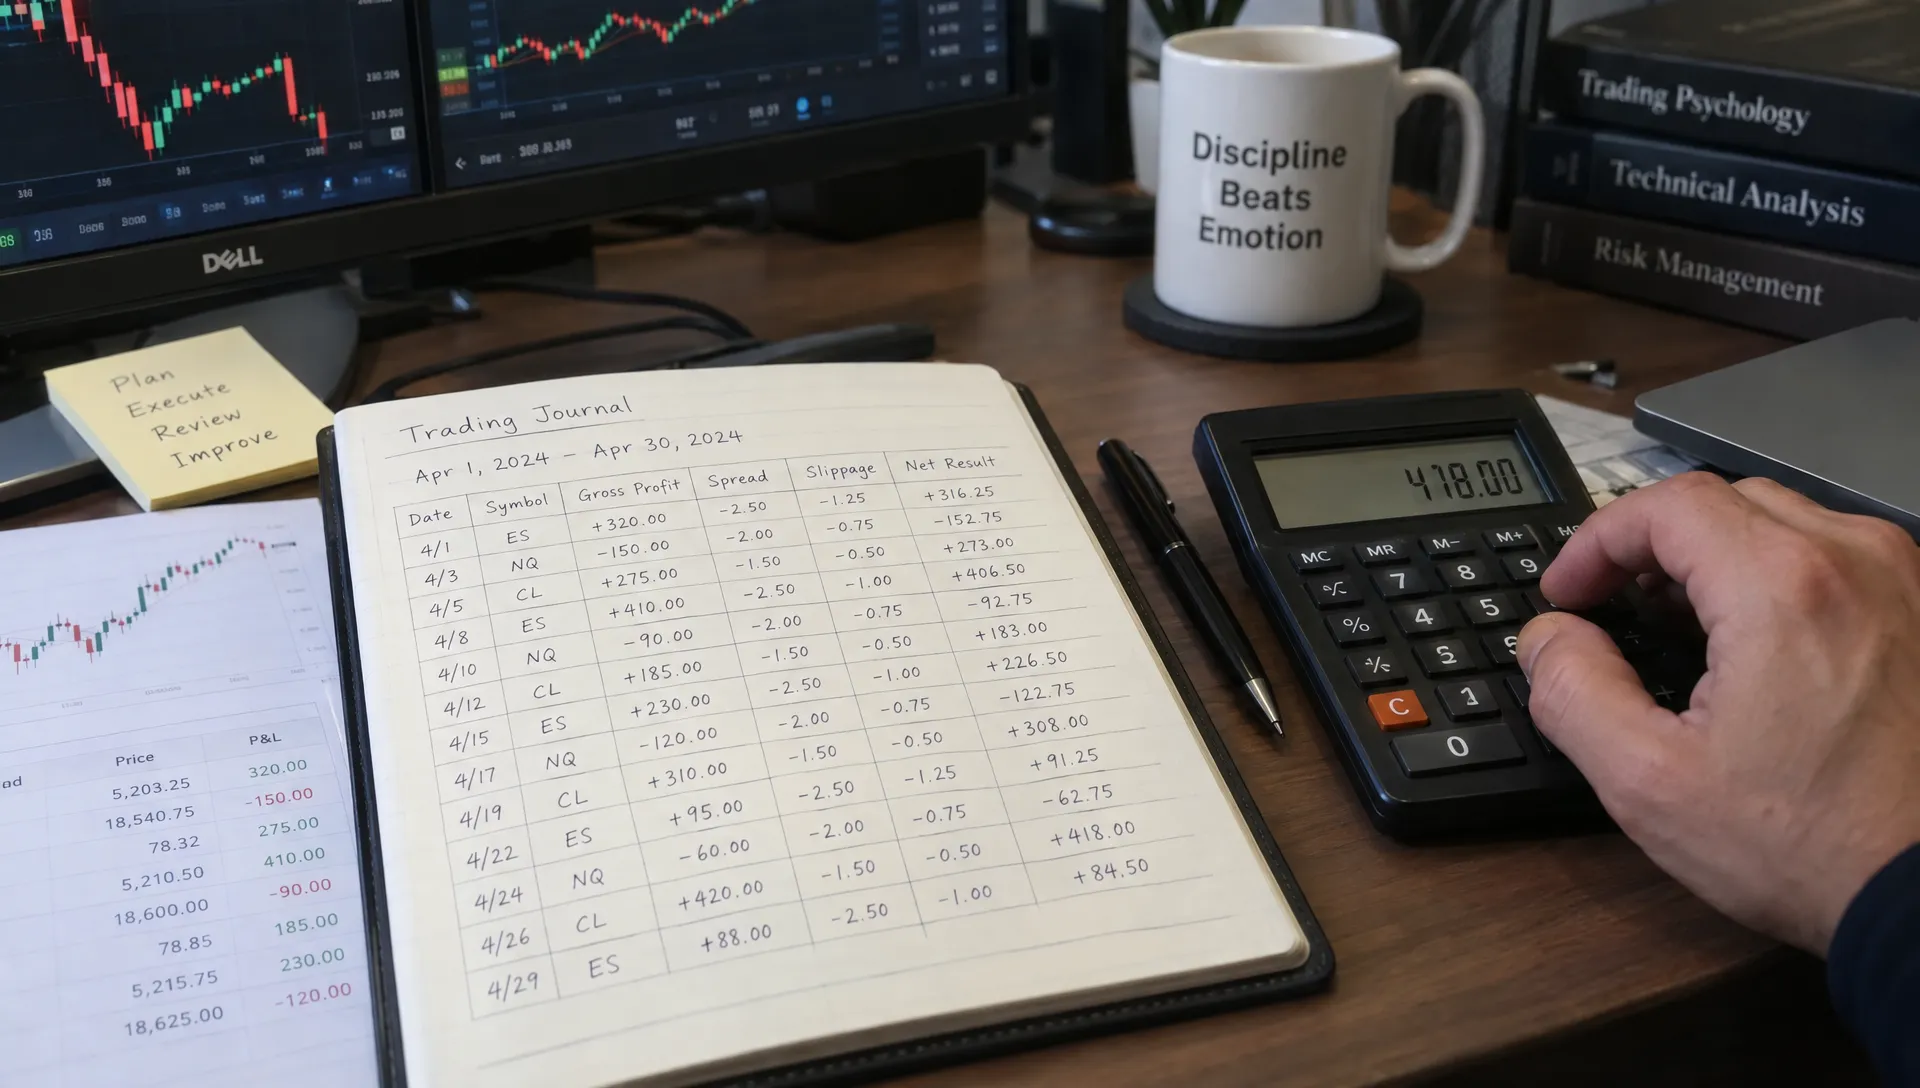
Net expectancy per trade = expected gross profit per trade minus expected trading costs per trade.
Costs include commissions, exchange or regulatory charges where applicable, the bid-ask spread and slippage. Short selling can introduce borrow-related expenses. Leveraged positions may introduce financing costs, depending on the instrument and holding period.
Zero commission does not mean zero execution cost. A market buy can execute near the ask and a market sell near the bid. Stop orders can also fill beyond their trigger price during fast movement.
Define your assumptions consistently. If simulated fills already use bid and ask prices, do not subtract the full spread again. If you model slippage separately, specify whether it includes or excludes spread costs.
A transparent example of costs changing the result
Consider an illustrative month with 100 completed trades, each using $10,000 of notional exposure. These are hypothetical assumptions, not observed results or forecasts.
Assume average gross profit is $8 per trade, calculated before execution costs. Model the spread at $2 per completed trade and additional adverse slippage at $3. Allocate a hypothetical $60 monthly data and software bill across the test.
| Item | Per completed trade | Across 100 trades |
|---|---|---|
| Gross trading profit | $8.00 | $800 |
| Spread cost | $2.00 | $200 |
| Additional slippage | $3.00 | $300 |
| Allocated data and software | $0.60 | $60 |
| Net result | $2.40 | $240 |
This simplified example assumes no commission, financing or borrow charges and excludes taxes. Actual charges must be added where relevant.
If combined spread and slippage double from $5 to $10, the same gross signals produce a $260 net loss, including the software allocation.
The best trend indicator for intraday trading can therefore change when execution assumptions change. A fast setup may capture more movements while retaining less profit than a slower, lower-turnover alternative.
Include software, data and research expenses
Many charting platforms include basic indicators, but reliable intraday data, specialist feeds or automation may require separate spending. Check exchange coverage, timestamp accuracy, session definitions and historical data quality before paying for additional features.
Compare incremental costs. A new subscription should solve a measurable problem, such as inadequate historical coverage, rather than promise that another signal will remove uncertainty.
If you outsource backtest development, hiring becomes another research expense. Skills-based recruitment platforms such as Koann can support candidate matching; verify a developer’s market-data handling and testing ability with a relevant work sample rather than screenshots of trading returns.
Keep research expenses separate from execution expenses in your records. Both affect economic viability, but separating them makes it easier to identify what needs improvement.
Turn the indicators into an executable strategy
An indicator is not a complete strategy. You also need an instrument universe, entry timing, exits, position sizing and rules for avoiding trades.
For a liquid US stock or ETF, the following is a reproducible research starting point, not a recommendation:
- Chart and session: Use five-minute regular-session bars, with session VWAP resetting daily and EMAs calculated consistently across regular sessions.
- Directional filter: Require the 21-period EMA to exceed the 50-period EMA, with the 50-period EMA above its value three completed bars earlier.
- Entry trigger: After 9:45 a.m. and before 3:30 p.m. Eastern, require a completed candle to cross above the 21-period EMA and close above VWAP. Simulate entry at the next bar’s executable opening price.
- Initial risk: Set a protective stop 1.5 times the signal bar’s 14-period ATR below entry and size the position from that distance.
- Exit: Exit after a completed close below the 21-period EMA, at the protective stop or five minutes before the regular-session close, whichever occurs first. Allow only one open position per instrument.
The settings above are deliberately explicit so someone else can reproduce the test. They are not claimed to be profitable.
To identify the best trend indicator for intraday trading within this framework, replace the EMA directional rule with a specified Supertrend rule while keeping other conditions unchanged. This helps isolate the effect of the indicator rather than comparing unrelated strategies.
Test the strategy without creating an imaginary edge
Make the data and fills realistic
Use data appropriate to the instrument and trading hours. Account for corporate actions, missing bars, market holidays and daylight-saving changes. Allow sufficient historical observations for indicator warm-up before scoring trades.
Never use a completed candle’s closing signal to assume an entry earlier in that candle. That introduces information unavailable at the time of execution.
Five-minute OHLC bars cannot reveal the sequence of every movement inside a bar. If both an entry and stop could occur within it, use finer data or a conservative assumption rather than selecting the favorable sequence.
For individual stocks, testing only today’s surviving winners can introduce survivorship bias. Either use a suitable historical universe or clearly limit the claim to the instruments actually tested.
Separate development, validation and final testing
One possible chronological structure uses 12 months for development, three months for validation and another three months as an untouched test. Those durations are illustrative; the number and diversity of independent trades matter too.
Use development data to define rules, validation data to choose between a small number of alternatives and the final period to evaluate the frozen strategy.
Selecting the best trend indicator for intraday trading on the same data used to tune its settings does not establish an edge. Repeatedly checking and modifying a strategy against the final test turns that period into development data.
Walk-forward testing can extend the process across several chronological windows. Preserve full sessions and use only past information at each decision point. Finish with paper trading or another forward observation period to compare modeled fills with obtainable execution.
Report more than win rate
A useful results sheet includes gross and net expectancy, trade count, average winner, average loser, maximum drawdown, exposure and turnover. Profit factor can add context, but it is unstable when based on very few trades.
Break results down by instrument, time of day and market condition. If you label trending and ranging sessions after the fact, do not treat those labels as a filter that could have been known beforehand.
Stress execution costs and test neighboring settings. A result that disappears when an EMA changes slightly or slippage increases modestly deserves skepticism.
A practical comparison records each candidate’s settings, data period, fill assumptions and out-of-sample result in the same format. There is no honest performance ranking without those details.
Control the mistakes an indicator cannot fix
The best trend indicator for intraday trading cannot compensate for oversized positions, illiquid instruments or abandoning exit rules.
Set a predefined loss budget per trade and a daily stopping condition. Calculate position size from the planned stop distance, then allow for execution costs. A stop limits the intended risk, not the maximum possible loss, because gaps and slippage can produce worse fills.
Avoid increasing size simply because several correlated indicators agree. EMA, MACD and Supertrend can all respond to the same underlying price move without providing independent confirmation.
Match settings to the instrument and interval. A 20-period EMA on a one-minute chart is not equivalent to a 20-period EMA on a five-minute chart. Likewise, stock-session rules should not be transferred unchanged to futures, options or continuously traded crypto markets.
Frequently asked questions
Which EMA is best for intraday trading? There is no universally best EMA. A 9/21 pair is more responsive than a 20/50 pair, but greater responsiveness can increase turnover. Compare predefined settings using the same entry, exit and cost assumptions.
Can free indicators outperform paid indicators? Yes, a strategy using freely available indicators can outperform one using paid tools. Price does not establish predictive value. Compare net results and data quality rather than subscription cost alone.
What is the best trend indicator for intraday trading options? Start by distinguishing the underlying asset’s direction from the option’s return. EMA, VWAP or Supertrend can describe the underlying, but option outcomes also depend on implied volatility, time decay, strike selection and option-market spreads. Test actual option pricing and execution rather than inferring returns from the underlying chart.
How many indicators should a beginner use? Start with one directional framework and, if needed, one tool that answers a different question. A simple, documented strategy is easier to diagnose than a collection of overlapping signals.
Keep short-term signals separate from portfolio decisions
Intraday execution and portfolio allocation answer different questions. A bullish five-minute chart does not establish that a holding suits your overall risk exposure.
For broader investment context, Upside Invest’s verified holdings and portfolio comparison tools let you explore anonymous investor allocations and compare portfolios. Use that information for portfolio research, not as a substitute for testing short-term trades.
This article is educational, not personalized investment advice. Intraday trading can cause rapid losses.