How to Build an Ownership Profile for Any Stock
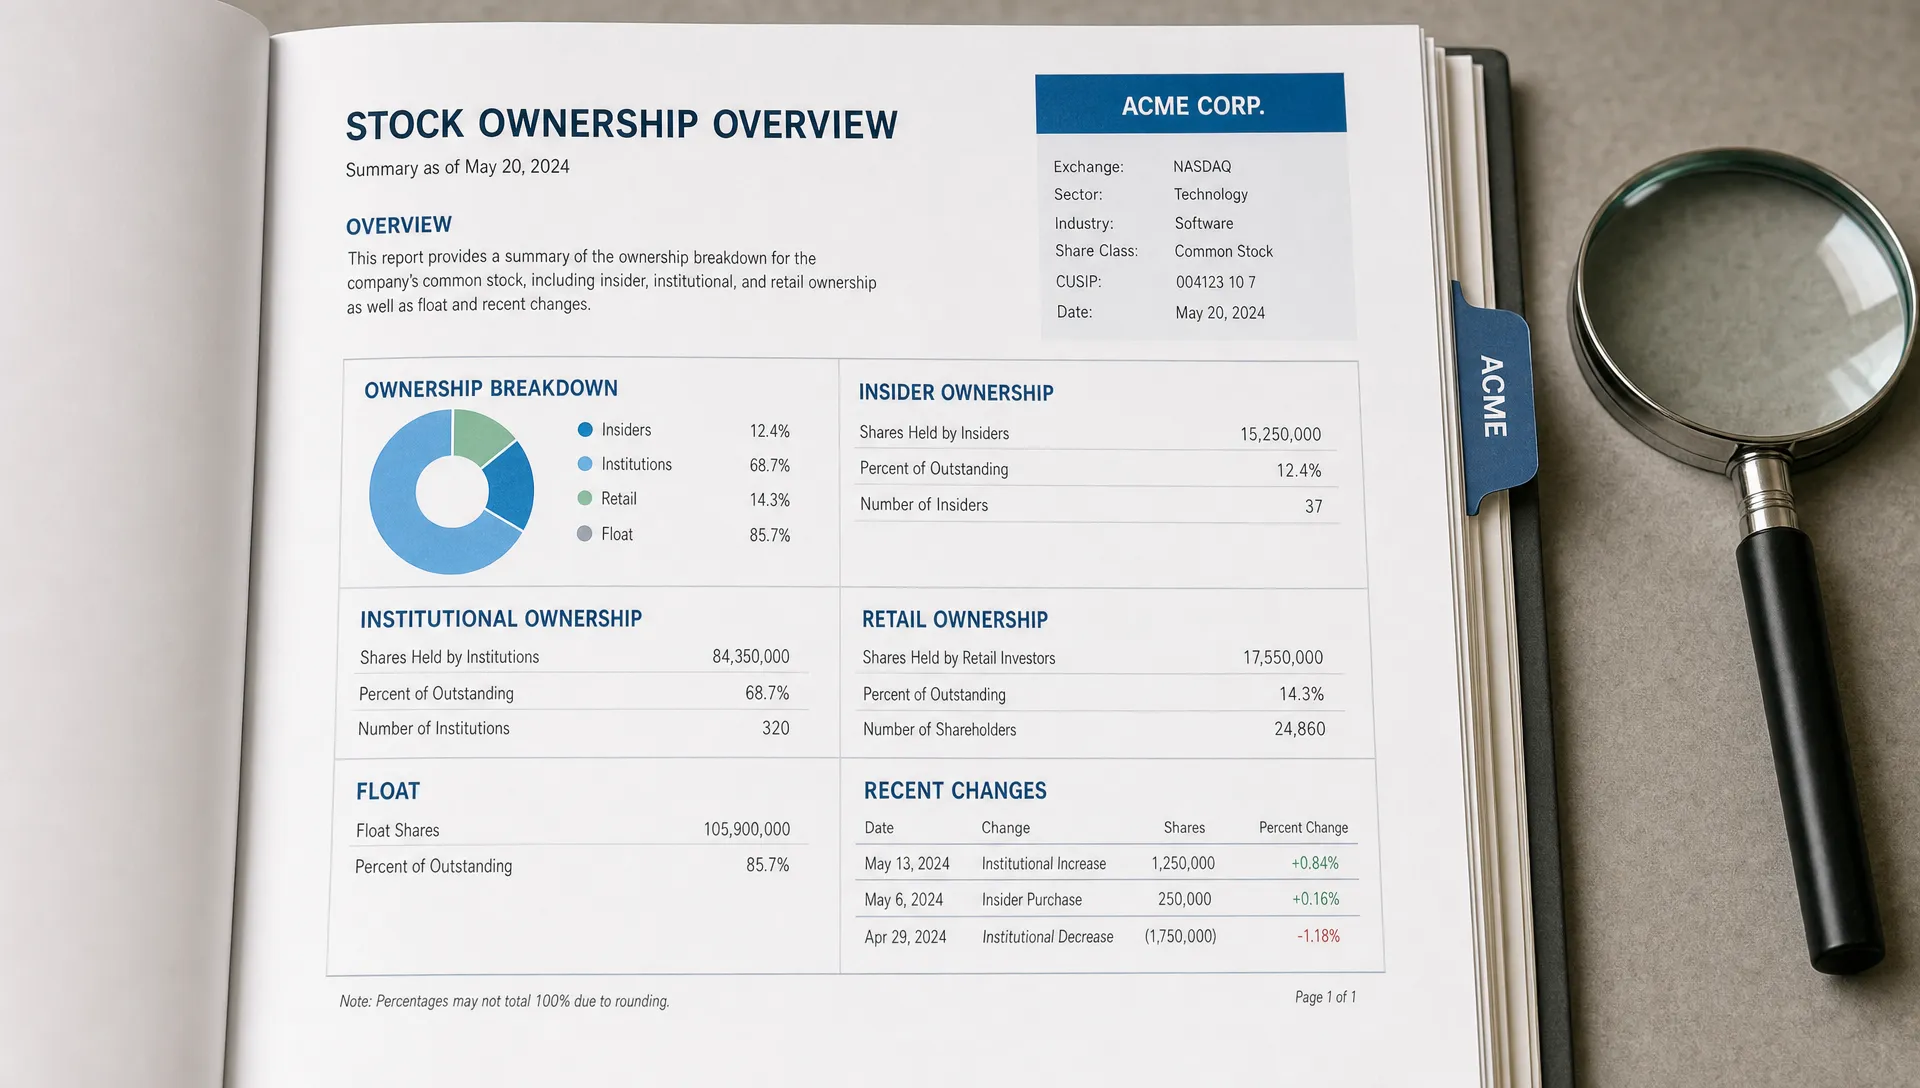
A stock’s price tells you what market participants are willing to pay today. Its ownership profile tells you who those participants are, how much influence they have and whether conviction is building or fading.
For retail investors, building an ownership profile is one of the most useful ways to move beyond headlines. It helps answer questions like:
- Are insiders aligned with common shareholders?
- Is the stock dominated by index funds, active managers, founders, employees or retail investors?
- Is a small float making the stock more sensitive to buying pressure?
- Are large holders accumulating, distributing or doing nothing?
- Could ownership concentration create governance, liquidity or dilution risk?
The goal is not to predict the next tick. A good profile gives context for valuation, business quality and sentiment. If you already track ownership basics, Upside Invest’s guide to stock ownership data every investor should track is a useful companion. This article focuses on turning those data points into a repeatable research workflow.
What an ownership profile should include
An ownership profile is a structured snapshot of who owns a stock and how that ownership is changing. It is part cap table, part behavioral map and part risk checklist.
At a minimum, it should cover five layers:
- Share base: shares outstanding, float, share classes, voting power and dilution sources.
- Insiders: founders, executives, directors, employee plans and recent insider transactions.
- Large holders: 5 percent beneficial owners, strategic investors and concentrated stakes.
- Institutions: mutual funds, ETFs, hedge funds, pensions and other reporting managers.
- Retail and market positioning: retail ownership signals, short interest, options activity and ownership concentration in the tradable float.
The more complete your profile, the easier it becomes to distinguish strong alignment from crowded enthusiasm, and real accumulation from stale data.
Start with the question you want the profile to answer
Before opening a filing or screener, define the decision the ownership profile needs to support. The right level of detail depends on the stock and your time horizon.
A long-term investor in a founder-led compounder may care most about insider alignment, voting control and dilution. A trader looking at a recent breakout may care more about float, short interest and whether retail or momentum funds are crowding in. A dividend investor may focus on stable institutions, buybacks and whether management owns enough stock to care about per-share returns.
Write the profile around one primary question, such as:
- Is ownership aligned with long-term shareholder value?
- Is the stock under-owned by institutions relative to its quality and liquidity?
- Are recent price moves supported by new buyers or just a low float squeeze?
- Could one owner, share class or financing structure create hidden risk?
This prevents the profile from becoming a data dump. Every field should help you interpret control, conviction, liquidity or change.
Step 1: Build the share base
The share base is the denominator for every ownership percentage. If the denominator is wrong, the entire profile is distorted.
Start with the company’s latest Form 10-Q or Form 10-K for shares outstanding. Then check the proxy statement, annual report or investor presentation for details on share classes, voting rights, stock-based compensation, warrants, convertible notes and repurchase programs.
Do not stop at market cap. For ownership research, you need to separate economic ownership from voting control and tradable supply.
| Field | Why it matters | Where to look |
|---|---|---|
| Shares outstanding | Base denominator for ownership percentage | 10-Q, 10-K, latest company filing |
| Public float | Shows how much stock is realistically tradable | 10-K cover page, market data providers |
| Fully diluted shares | Captures options, RSUs, warrants and convertibles | 10-K, 10-Q, equity compensation notes |
| Share classes | Reveals voting differences between economic and control stakes | Proxy statement, charter disclosures |
| Buyback authorization | Can shrink share count and change holder percentages | 10-Q, 10-K, press releases |
| Recent issuance | May dilute holders or bring in new strategic owners | 8-K, prospectus, registration statement |
A company with 20 percent insider ownership may look highly aligned, but the meaning changes if insiders control 70 percent of votes through a dual-class structure. Similarly, a company with modest institutional ownership can still be heavily institution-controlled if the public float is small.
Step 2: Pull the primary ownership sources
For U.S.-listed companies, the SEC EDGAR database is the best starting point. Screeners and data providers save time, but filings let you verify definitions, dates and footnotes.
The core filing types are:
| Source | What it tells you | Key caveat |
|---|---|---|
| DEF 14A proxy statement | Directors, executives and principal shareholders | Often includes options exercisable within 60 days |
| Form 4 | Insider purchases, sales, gifts and option exercises | Transaction codes matter, not all sales are bearish |
| Schedule 13D | Activist or active 5 percent beneficial ownership | Intent and amendments can be as important as share count |
| Schedule 13G | Passive or exempt 5 percent beneficial ownership | Less detail on intent than 13D |
| Form 13F | Quarterly holdings of qualifying institutional managers | Delayed and long-only for listed securities |
| 10-K and 10-Q | Share count, dilution, buybacks and risk factors | Ownership data may not be fully current |
| S-1 or prospectus | Pre-IPO holders, lockups and selling shareholders | Important after IPOs and secondary offerings |
If you want a deeper filing-specific process, use this walkthrough on how to find stock ownership changes in SEC filings alongside your own spreadsheet.
For non-U.S. stocks, use the equivalent local regulator and exchange disclosures. The concepts are the same, but reporting thresholds, deadlines and beneficial ownership rules differ by market.
Step 3: Classify the owners, not just the percentages
A common mistake is to treat all ownership as interchangeable. It is not.
A founder who owns 12 percent and votes 45 percent of the company behaves differently from an index fund that owns 12 percent through passive products. A hedge fund with a fresh 13D filing behaves differently from a pension fund that has owned the stock for years. A strategic corporate investor may care about commercial access as much as financial return.
Group owners into practical categories:
- Insiders and founders
- Directors and executive officers
- Employees or ESOP-related holders
- Strategic investors and corporate holders
- Passive institutions and index funds
- Active institutions and mutual funds
- Hedge funds and activists
- Retail investors and community holders
- Short sellers and synthetic exposure indicators
Short sellers do not own the company, but short interest belongs in the profile because it affects float dynamics, borrow pressure and potential volatility. Options activity can also help explain whether the market is expressing ownership-like exposure outside common shares, though it should not be treated as direct ownership.
Step 4: Create the ownership profile table
A simple spreadsheet is enough. The point is to standardize your fields so you can compare one stock with another and update the profile without rebuilding it each time.
Here is a practical template:
| Field | Example entry |
|---|---|
| Ticker and company | ABC, ABC Robotics Inc. |
| Snapshot date | August 22, 2026 |
| Shares outstanding | Latest reported diluted or basic count, clearly labeled |
| Public float | Source and date included |
| Owner name | Vanguard, founder CEO, activist fund, employee plan |
| Owner category | Passive institution, insider, retail cohort, strategic holder |
| Shares owned | Number of shares or best available estimate |
| Percent of shares outstanding | Shares owned divided by shares outstanding |
| Percent of float | Shares owned divided by public float, if relevant |
| Voting power | Especially important for dual-class stocks |
| Source | DEF 14A, Form 4, 13F, 13D, platform data |
| Filing or data date | The date the ownership data actually reflects |
| Change versus prior period | Increase, decrease, new position or exit |
| Conviction note | Buy, grant, automatic sale, passive rebalance, activist filing |
| Risk note | Concentration, lockup, pledge, dilution, stale data |
The key is to label each date clearly. A 13F filed in mid-May usually reflects holdings from March 31, not May. A proxy may show beneficial ownership near the record date, not today. Platform or brokerage ownership signals may update more frequently, but methodology matters.
Step 5: Separate insider alignment from insider activity
Insider ownership is usually one of the most important parts of an ownership profile, but it requires careful interpretation.
High insider ownership can signal alignment, especially when founders and executives built their stakes through open-market purchases or long-term retention. It can also signal control risk if outside shareholders have little influence. Low insider ownership is not automatically bad, especially in mature companies with professional management, but it does raise questions about incentives.
Recent insider activity needs its own context. Open-market purchases often carry more signal than stock grants. Sales can mean diversification, tax planning, estate planning or loss of confidence. Rule 10b5-1 trading plans can reduce the informational value of a sale, but the size, timing and pattern still matter.
For each insider, capture:
- Current beneficial ownership
- Voting power, if different from share ownership
- Open-market purchases during the past 6 to 24 months
- Sales pattern and whether sales were planned
- Option exercises, grants and expiring awards
- Any pledging or margin loan disclosure in the proxy
If an insider owns a large stake but is consistently selling into every rally, your profile should show both facts. Alignment is not static.
Step 6: Read institutions by type and behavior
Institutional ownership can be reassuring, but the headline percentage is often misleading. A stock that is 75 percent institution-owned may be widely held by passive funds with little stock-specific conviction. Another stock with 25 percent institutional ownership may have a few skilled active managers building meaningful positions.
Break institutional holders into passive and active categories where possible. Index funds often buy because a stock belongs in an index, sector or factor basket. Active managers usually have a thesis, although you still need to inspect position size and changes. Activists, event-driven funds and sector specialists deserve separate notes because their holding patterns can affect governance and catalysts.
The 13F system has limits. It does not show short positions, most non-U.S. holdings, cash, every derivative or the manager’s full portfolio intent. It is also delayed. For a more detailed interpretation framework, see Upside Invest’s guide on how to read institutional ownership of a stock.
Your profile should answer three questions about institutions:
| Question | Why it matters |
|---|---|
| Who owns the largest positions? | Shows influence, voting power and potential selling pressure |
| Who is adding or reducing? | Reveals flow, though with reporting delays |
| Are the buyers natural long-term holders? | Helps separate durable sponsorship from fast money |
Institutional ownership is most useful when combined with float, valuation and business context. A quality small-cap with improving fundamentals and low institutional ownership may have room for discovery. A mega-cap already owned by every large fund has a different setup.
Step 7: Add retail ownership signals carefully
Retail ownership is harder to measure than institutional ownership, but it can reveal early demand, product enthusiasm and crowding risk. The quality of the signal depends on the source.
Brokerage popularity lists, verified portfolio platforms, shareholder communities and transfer agent data can all provide partial clues. Social media mentions are weaker because attention is not the same as ownership. Search trends and forum activity may explain sentiment, but they should not be counted as shares owned unless tied to verified holdings or disclosed positions.
Upside Invest is built around this gap: it lets investors compare allocations and learn from verified anonymous portfolio data without exposing personal profiles. For an ownership profile, that kind of anonymized verification can help distinguish actual holder behavior from loud commentary.
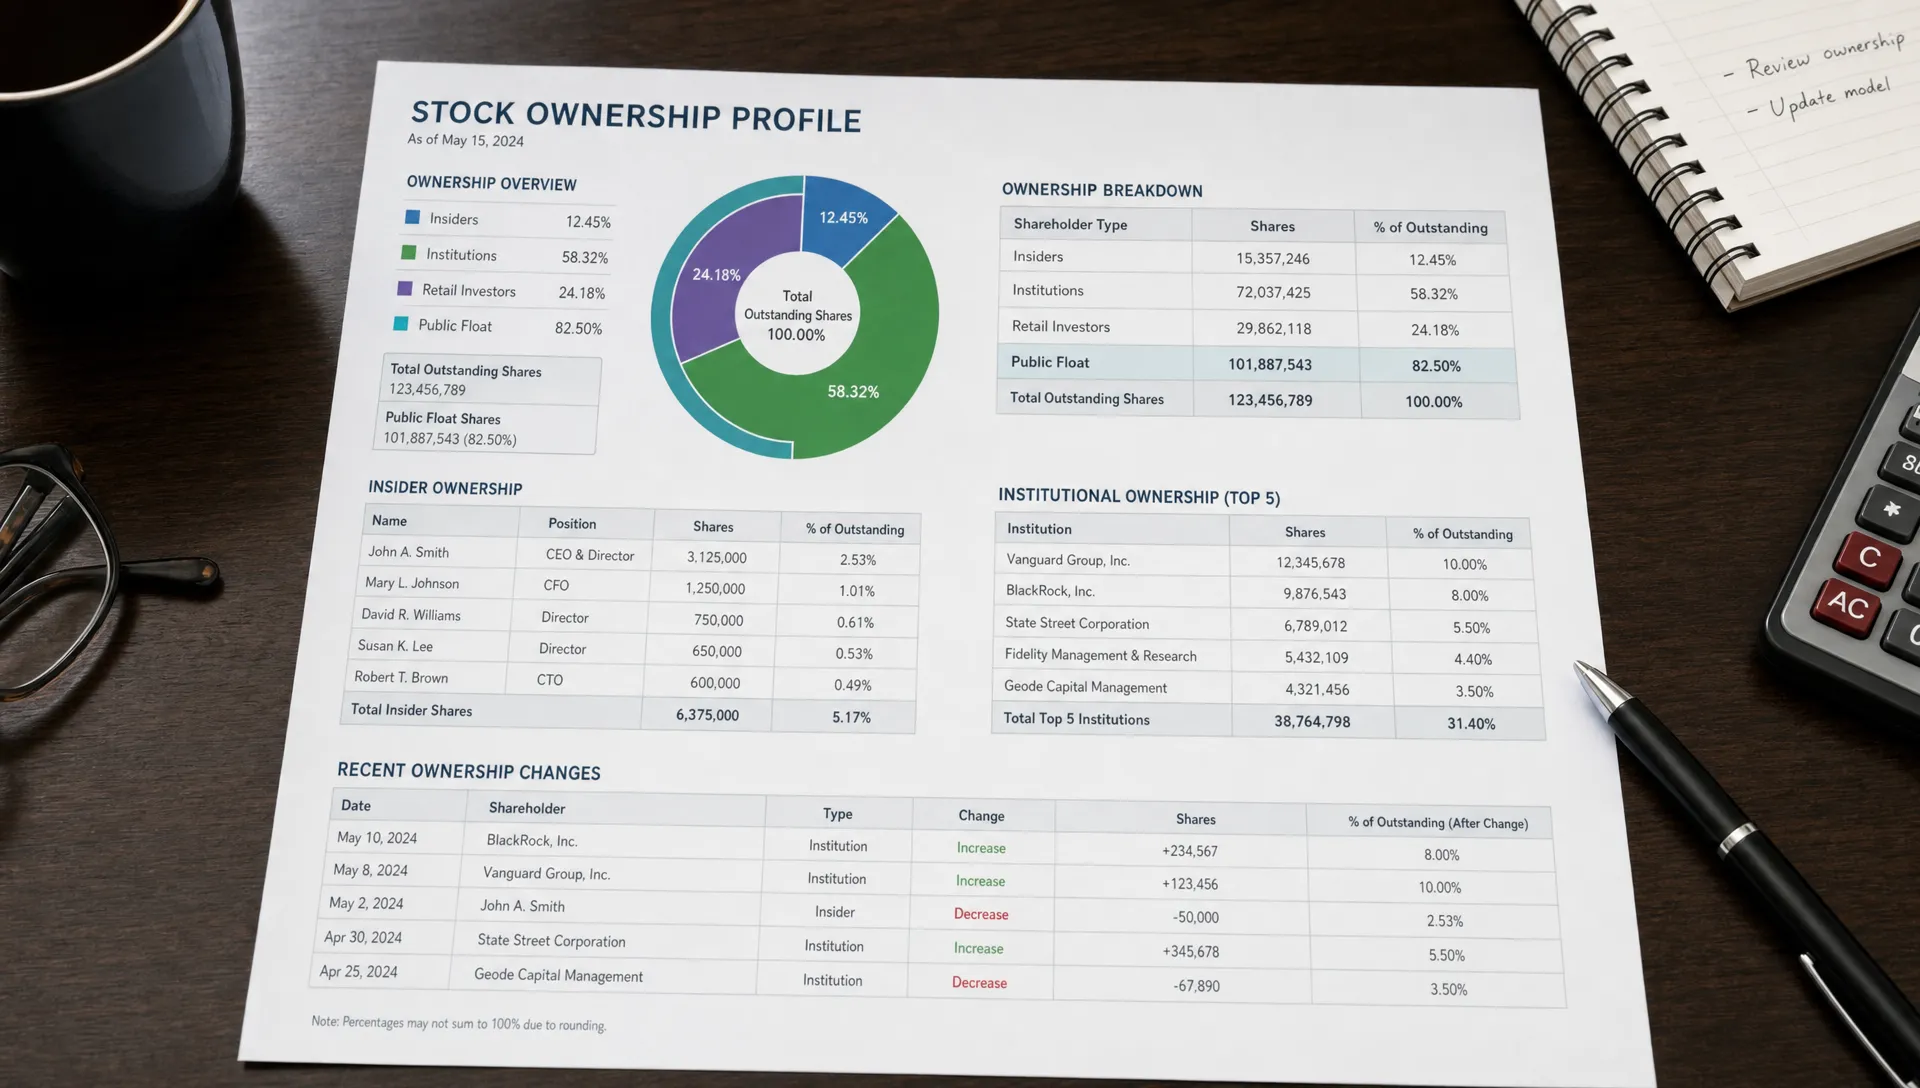
Step 8: Look for ownership patterns, not isolated signals
Once the table is filled in, step back and interpret the pattern. No single ownership metric is enough. The profile becomes useful when the pieces reinforce or contradict each other.
| Pattern | Possible interpretation | What to verify |
|---|---|---|
| High insider ownership, recent insider buying, reasonable float | Strong alignment and potential confidence | Compensation structure, valuation and business momentum |
| High insider voting control, low outside influence | Stable leadership or governance risk | Related-party deals, board independence and share classes |
| Low institutional ownership, improving fundamentals | Potential under-discovery | Liquidity, index eligibility and sell-side coverage |
| Rising institutional ownership, falling insider ownership | Professional sponsorship but weaker insider alignment | Sale reasons and whether institutions are passive or active |
| Heavy passive ownership, low float | Price may react sharply to index flows | Rebalance dates, liquidity and short interest |
| Large activist stake with 13D amendments | Potential catalyst or conflict | Activist history, board response and proposed changes |
| High retail concentration and high short interest | Momentum potential with volatility risk | Borrow cost, float size and position crowding |
| Significant dilution over several years | Ownership leakage despite business growth | SBC, convertibles, warrants and capital needs |
The best profiles highlight tension. For example, a stock can have high insider ownership and still be a poor investment if dilution is excessive or valuation assumes perfect execution. A stock can have low insider ownership and still be attractive if capital allocation is disciplined and management pay is tied to per-share value creation.
Step 9: Track changes over time
An ownership profile is a living document. The first version gives you a baseline, but the real insight often comes from changes.
Update the profile after:
- Quarterly 13F filing waves
- Annual proxy statements
- Material Form 4 insider transactions
- 13D or 13G filings and amendments
- Secondary offerings, buybacks or convertible issuance
- Index inclusions or deletions
- Major price moves that may change float dynamics
Keep a change log with dates and short notes. You do not need a long essay for every update. A good note might read: two active small-cap funds initiated positions in Q2; founder sold 3 percent of stake under 10b5-1 plan; float increased after lockup expiration; short interest rose while borrow remained available.
That kind of record helps you avoid recency bias. It also makes it easier to notice when the ownership story changes before the price story does.
Step 10: Automate where possible, but keep judgment in the loop
Ownership research is repetitive. Filing dates, tables, holder names and share counts can be monitored with alerts and data workflows. Automation helps, especially if you track many stocks.
Useful automations include filing alerts, insider transaction feeds, 13F comparison scripts, ownership concentration dashboards and reminders for proxy season. Investors or research teams building custom workflows can also work with an AI agency such as Impulse Lab’s custom web and AI solutions to connect filings, data sources and internal research processes.
Still, automation should not replace interpretation. A model can flag that an institution reduced a stake by 40 percent. You still need to ask whether that was a thesis change, an index rebalance, a fund closure, a risk limit or stale reporting noise.
Common mistakes to avoid
The fastest way to weaken an ownership profile is to mix clean data with sloppy assumptions. Watch for these mistakes:
- Comparing ownership percentages that use different share counts.
- Treating voting power and economic ownership as the same thing.
- Assuming every insider sale is bearish or every insider purchase is bullish.
- Treating 13F data as real-time.
- Ignoring passive versus active institutional ownership.
- Counting social media attention as retail ownership.
- Forgetting dilution from stock-based compensation, convertibles and warrants.
- Ignoring lockups, pledges and related-party arrangements.
- Looking only at top holders instead of changes in holder behavior.
A good ownership profile should make uncertainty visible. If a number is estimated, label it. If a source is delayed, note the delay. If a holder’s intent is unclear, say so.
A simple ownership profile workflow you can repeat
For most stocks, you can build a solid first profile in less than an hour once you know the process.
Start with the company’s latest 10-Q or 10-K and record shares outstanding, float, dilution and share classes. Read the proxy for insider and principal shareholder data. Pull recent Form 4 filings for insider activity. Check 13D and 13G filings for large beneficial owners. Review the latest 13F data for major institutional holders, remembering the lag. Add verified retail or community ownership signals where available. Then write a short interpretation that explains who controls the stock, who is accumulating, who may sell and which ownership risks deserve monitoring.
The final paragraph is as important as the table. If you cannot explain the ownership setup in plain language, you probably have not finished the profile.
Frequently Asked Questions
What is an ownership profile for a stock? An ownership profile is a structured view of who owns a stock, how much influence they have, how ownership is changing and what that means for alignment, liquidity, governance and potential price behavior.
How often should I update an ownership profile? For long-term holdings, update it at least quarterly after 13F filings and again after the annual proxy. Update sooner after major insider transactions, activist filings, secondary offerings, lockup expirations or large price moves.
Is high insider ownership always good? No. High insider ownership can signal alignment, but it can also create control risk if voting power is concentrated and outside shareholders have limited influence. Look at governance, selling patterns, compensation and dilution.
Can retail investors really estimate retail ownership? They can build useful signals, but exact retail ownership is often hard to measure. Verified portfolio data, brokerage popularity indicators and shareholder community data are stronger than social media activity alone.
What is the biggest limitation of institutional ownership data? The biggest limitation is timing and completeness. Form 13F data is delayed and does not show short positions, full derivatives exposure or the manager’s complete intent.
Build better ownership context with Upside Invest
Ownership research is more powerful when you can compare it with what real investors are actually holding. Upside Invest helps retail investors benchmark portfolios, explore verified anonymous holdings, track investor moves and discover trends across stocks, funds and crypto.
Use your ownership profile as the foundation, then compare it against real portfolio behavior to see whether your thesis is isolated, early or already crowded.