Long Term Trend Following and the Cost of Whipsaws
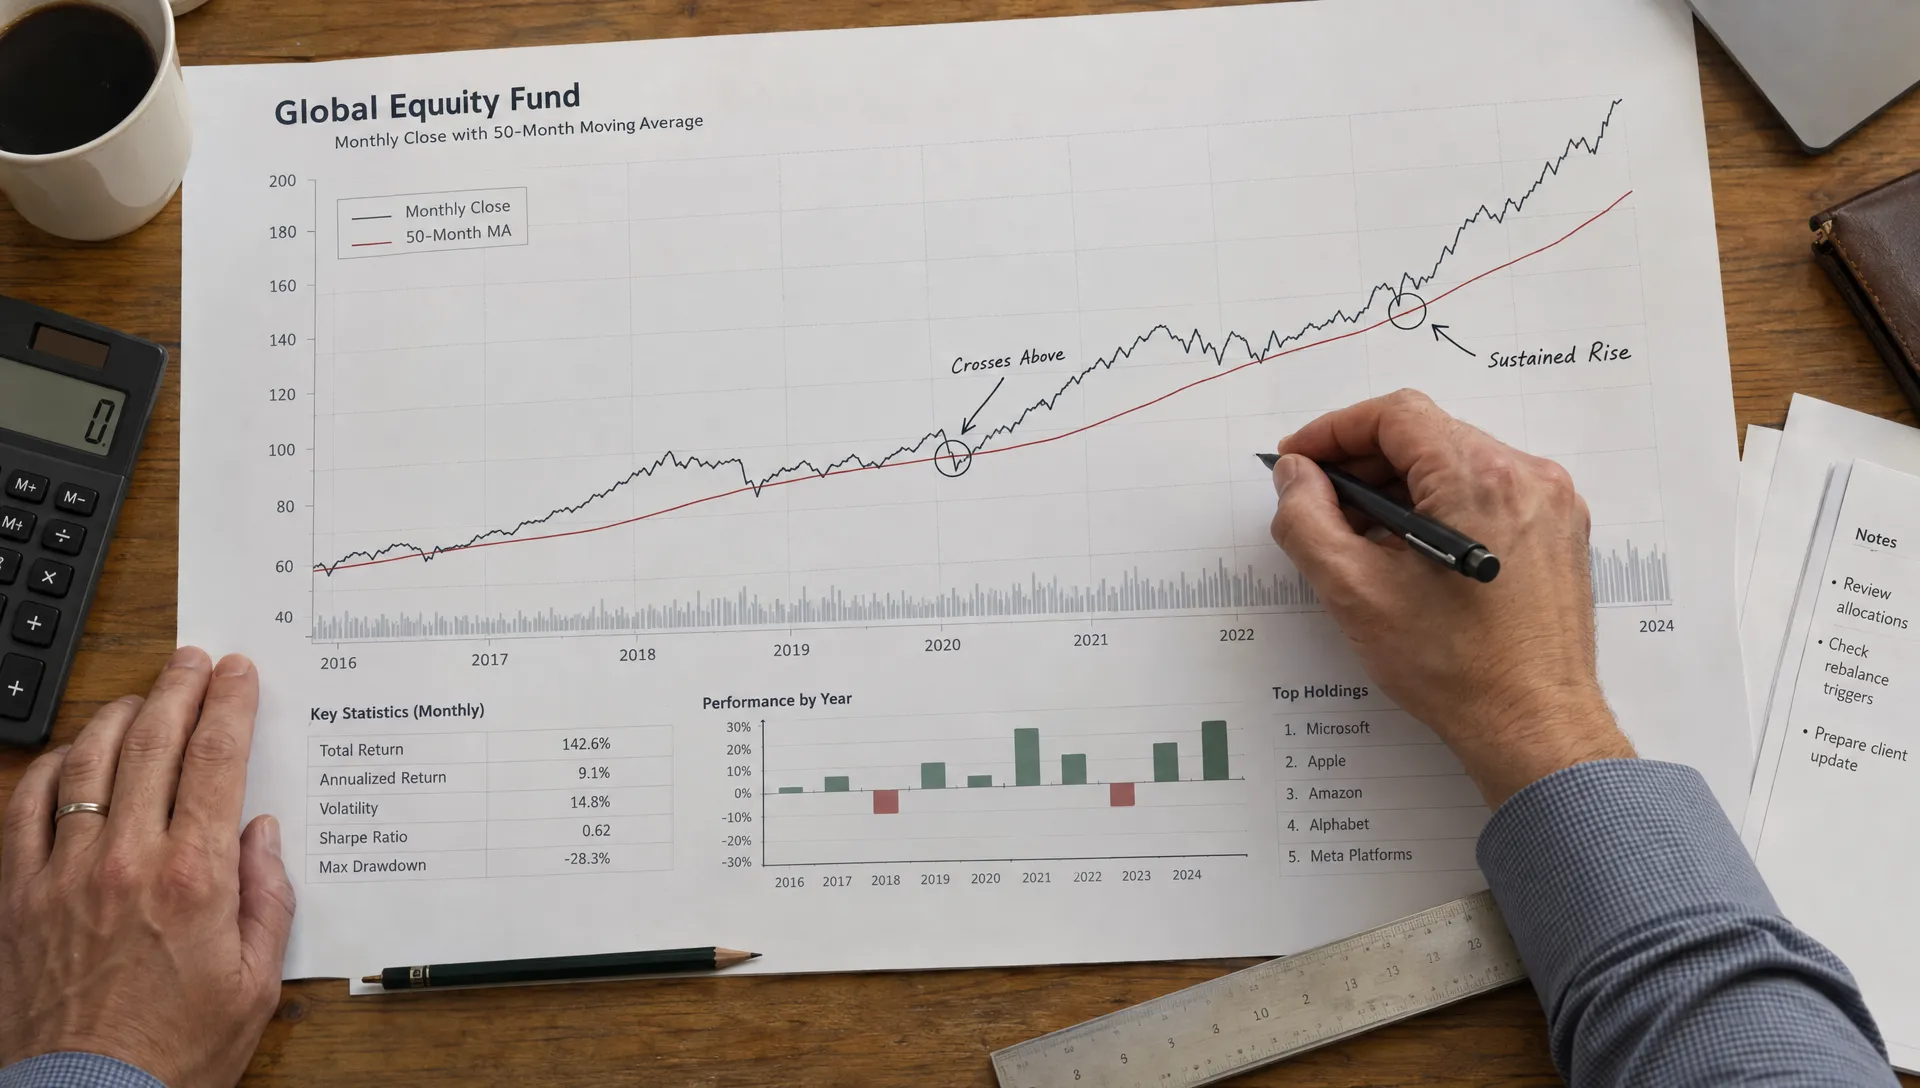
Long term trend following accepts a frustrating trade-off: you will sometimes sell after a decline, buy back after a recovery and lose money even though the market has gone nowhere. Those false starts, known as whipsaws, are not necessarily evidence that the strategy is broken. They are part of the cost of waiting for sustained trends.
The practical question is whether those costs remain tolerable after trading expenses, missed rebounds and taxes. A useful approach starts with understanding what you are paying for, then testing whether the occasional large trend can justify the bill.
Why false signals are built into the strategy
A trend-following rule responds to price behavior rather than predicting business value or economic turning points. A simple long-only version might hold an equity fund when its monthly closing price is above a moving average and move to cash when it falls below.
That rule cannot distinguish a temporary decline from the beginning of a prolonged bear market. Both can look identical when the exit signal arrives.
A whipsaw occurs when a signal reverses before a sustained move develops. You exit, prices recover and you reenter at a higher level. Alternatively, you buy after an upward signal, then sell lower when that move fails.
Slower signals generally trade less frequently, but they react later to genuine reversals. Faster signals respond sooner but can generate more false starts. Neither removes uncertainty.
In long term trend following, the objective is not to eliminate losing trades. It is to keep their cumulative damage manageable while preserving exposure to meaningful trends. A high win rate is therefore less informative than the relationship between average losses, profitable moves and total portfolio risk.
What repeated reversals actually cost
Whipsaws impose several distinct costs: realized losses, execution expenses and time spent outside a rising market. Tax consequences may add another layer in taxable accounts.
Consider a hypothetical $100,000 strategy that experiences three consecutive losses of 2% of account equity, followed by an 8% gain. These are illustrative account returns, not a forecast, and exclude fees and taxes.
| Stage | Account return | Account value |
|---|---|---|
| Starting balance | Not applicable | $100,000.00 |
| First losing period | -2% | $98,000.00 |
| Second losing period | -2% | $96,040.00 |
| Third losing period | -2% | $94,119.20 |
| Subsequent winning period | +8% | $101,648.74 |
The three losses produce a 5.88% drawdown. Recovering from that drawdown requires approximately 6.25%, not 5.88%, because the recovery starts from a smaller balance.
The later 8% gain leaves the account only about 1.65% above its starting value. This is why adding trade percentages together gives a misleading picture.
The cost of long term trend following also includes missed exposure. Selling before a sharp rebound can hurt relative performance even when the exit trade itself looks modest. Measure both the money lost and the return forgone against an appropriate benchmark.
What historical research does and does not establish
The research case for trend following is broader than a moving-average rule applied to one stock.
Moskowitz, Ooi and Pedersen’s 2012 paper, Time Series Momentum, examined an asset’s own past returns as a signal across futures markets, including equity indexes, currencies, commodities and bonds. That setting differs materially from a retail investor switching between a single equity ETF and cash.
A diversified futures strategy can take both long and short positions, spread risk across markets and adjust exposures using volatility estimates. A long-only stock strategy cannot assume it will inherit the same return pattern or diversification benefits.
Individual shares also carry company-specific risks. Bankruptcy, dilution or a sudden earnings gap can overwhelm an otherwise sensible signal. Diversifying across several stocks in the same industry may leave substantial common exposure.
Historical evidence makes long term trend following worth evaluating, but it does not establish a dependable future return. Conclusions depend on the sample period, market universe, leverage, financing assumptions and benchmark. Performance during prolonged market trends may look very different from performance during repeated, rapid reversals.
For a long-only equity strategy, cash yield and time out of the market can materially affect the result. Those details belong in the analysis, not in a footnote.
Choose a signal horizon around your objective
Start by deciding what the strategy is meant to accomplish. Seeking lower equity exposure during prolonged declines is different from seeking an absolute-return strategy across multiple asset classes.
For a simple educational test, define a rule before examining its results: at each month-end, compare an equity fund’s adjusted closing price with its 10-month moving average. Hold the fund above the average and cash otherwise. Execute after the signal becomes observable.
This is an example to test, not an endorsed parameter choice. Define what happens when price equals the average and use consistent treatment of distributions.
| Decision | Slower signal | Faster signal |
|---|---|---|
| Response to a genuine reversal | Usually later | Usually earlier |
| Trading frequency | Generally lower | Generally higher |
| Exposure to brief fluctuations | Typically lower | Typically higher |
| Main compromise | More delayed adjustment | More false starts |
Some investors test confirmation periods or a buffer around the moving average. These can reduce repeated crossings, but may also delay useful trades. Their net effect must be measured.
The best horizon for long term trend following is not simply the one with the highest backtested return. It must also fit your review schedule, implementation costs and willingness to endure periods of underperformance.
Size positions for a losing streak
A signal determines direction. Position sizing determines how much damage a wrong signal can cause.
Putting an entire account into one volatile asset makes the experience depend heavily on that asset’s behavior. A correct long-horizon view may still involve a drawdown you cannot tolerate.
Volatility targeting adjusts exposure using an estimate of market volatility. In principle, higher estimated volatility means a smaller position for the same risk target. But the estimate is backward-looking: abrupt moves can occur before the model reduces exposure, and quiet periods can encourage excessive leverage if there is no cap.
For a straightforward retail test, unlevered exposure with explicit position limits is easier to interpret. If testing volatility-based sizing, specify the estimate, rebalance frequency and maximum exposure in advance.
Also examine shared risks. Several technology holdings may behave like one concentrated position during a sector selloff. Even a familiar company such as Visa, whose Upside profile includes sector and community ownership information, remains a single-stock exposure rather than a diversified equity allocation.
For long term trend following, position size should make a plausible losing streak financially survivable. Historical maximum drawdown is a scenario to examine, not a ceiling on future losses.
Keep near-term financial obligations outside the strategy
Money needed for housing, taxes or essential spending should not depend on catching the next trend. Otherwise, a temporary drawdown can force a withdrawal at exactly the wrong time.
Financial distress also requires a different response from portfolio optimization. A UK homeowner facing repossession, for example, needs to address the property and debt situation directly. Faster Property Solutions’ support for homeowners facing repossession is one specialist option to investigate alongside independent debt advice. Review the terms and implications of any proposed arrangement.
Separating essential liquidity from investment capital reduces the chance that an ordinary strategy drawdown becomes a household emergency.
How to test long term trend following honestly
A backtest should reproduce decisions you could actually have made, at prices you could plausibly have received. Three checks are especially useful.
Use observable signals and executable trades
If a signal uses the final closing price of the month, that price is not known until the session ends. Assuming you also execute at that exact close can introduce look-ahead bias. A cleaner test uses the next available execution opportunity with realistic pricing assumptions.
Use distribution-adjusted data consistently when constructing signals, then model tradable returns and cash flows correctly. For stock universes, include delisted companies and historical membership rather than testing only today’s survivors.
Avoid silently replacing a fund’s unavailable early history with index returns. If a proxy is necessary, disclose it and account for differences in fees, investability and tracking.
Charge the strategy for implementation
Include commissions where applicable, bid-ask spreads, slippage and relevant fund expenses. A zero-commission brokerage account does not make trading frictionless.
Model the return earned while out of the market rather than treating cash as either permanently worthless or automatically invested at an unavailable rate. Futures tests also need appropriate treatment of contract rolls, collateral and financing.
Taxes depend on account type and jurisdiction. At minimum, compare turnover and holding periods, and distinguish pretax results from any investor-specific after-tax analysis.
Run cost sensitivity tests rather than relying on a single optimistic estimate. If slightly higher trading costs erase the apparent benefit, the strategy has little margin for implementation error.
Test robustness rather than hunting for a perfect setting
Divide research from evaluation. Choose parameters using one period, then examine later data without retuning the rule to improve those results. A walk-forward process can repeat that separation through time.
Test nearby signal settings and different market environments. A useful result should not depend entirely on one unusually favorable moving-average length or one crisis that dominates the sample.
For long term trend following, examine whipsaw-heavy stretches separately from sustained trends. Count losing streaks, time out of the market and delayed reentries. These reveal whether the historical experience was tolerable, not just profitable on average.
Repeatedly inspecting and modifying a strategy can overfit even an apparently untouched test set. Keep a record of the versions you tried and resist treating the eventual winner as an independent discovery.
Judge the result against the job it must do
Annualized return alone cannot tell you whether accepting whipsaws was worthwhile. Compare the strategy with buy-and-hold in the same investable universe and, where relevant, a simpler lower-risk allocation.
A strategy that holds cash frequently may have lower drawdowns largely because it takes less market risk. That can still be useful, but it is different from demonstrating superior timing skill.
Track maximum drawdown, time underwater, volatility, turnover and average market exposure. Sharpe ratios can help summarize risk-adjusted performance, though they do not fully describe tail losses or the discomfort of a long recovery.
The hardest cost of long term trend following may be behavioral: staying with a rule after several small losses while a buy-and-hold benchmark rebounds. Switching systems after every disappointing stretch can combine the costs of several approaches without capturing their intended benefits.
Before investing, write down a review schedule and reasons that would justify changing the system. Unexpected execution problems or a flawed assumption deserve attention. A losing streak already represented in the test is not, by itself, proof of failure.
Frequently asked questions
Does trend following still work? Historical research supports trend effects in multiple markets, but future profitability is uncertain. Results depend on the instruments, signal rules, position sizing and implementation costs. Evidence for diversified futures strategies should not be treated as proof for a single-stock system.
Can you eliminate whipsaws with a longer moving average? No. A longer average may reduce sensitivity to short fluctuations, but it usually reacts later to genuine reversals. It changes the trade-off rather than removing it.
Is a trailing stop-loss useful for this approach? It can provide a predefined exit rule, but repeated stop-outs can create whipsaws. Gaps and slippage can also make the execution price worse than the stop level. Test the stop together with its reentry rule.
How much underperformance should you tolerate? There is no universal threshold for long term trend following. Compare actual results with the strategy’s tested behavior, including losing streaks and time underwater, while recognizing that future outcomes can be worse. Your financial capacity to continue matters as much as the backtest.
Compare portfolio context without copying trades
Upside Invest lets investors compare allocations and explore verified holdings through private, anonymous profiles. That context can help you identify concentration and understand how your portfolio differs from others.
Use community holdings as research input, not as a substitute for tested trading rules. Before implementing a strategy, define its signal, size its risks and calculate what repeated false starts would cost. This article is educational, not personalized investment advice.