Price Action Trend Trading Without Technical Indicators

Price action trend trading uses price swings, candle behavior and important levels to identify trends and plan trades without moving averages, RSI or other technical indicators. The objective is not to predict every turn. It is to define when a trend is intact, where an entry makes sense and what price would invalidate the idea.
A clean chart does not automatically produce a profitable strategy. You still need consistent rules, realistic execution assumptions and evidence from testing. This guide builds that framework with two hypothetical trades, position-sizing calculations and a practical way to distinguish a pullback from a possible reversal.
What trading without indicators actually means
A price chart already contains several useful observations: where trading opened and closed, how far price traveled and whether buyers or sellers sustained a move. Trading without indicators means making decisions from those observations rather than mathematical overlays derived from them.
You can still draw horizontal levels, mark swing points and calculate position size. Those activities organize price information and control risk; they do not require a technical indicator.
The limitation is interpretation. Two people can identify different swings on the same chart, especially after seeing what happened next. A usable method must therefore specify which swings matter and what qualifies as confirmation.
For price action trend trading, the central question is whether successive advances and declines support the same directional thesis. A recognizable candle pattern matters only when its location, market structure and potential reward justify taking risk.
Read structure before you name a pattern
Higher highs, lower lows and meaningful swings
An uptrend generally produces higher swing highs and higher swing lows. A downtrend generally produces lower highs and lower lows. When those sequences overlap or disappear, the market may be ranging rather than trending.
Use completed swings on your chosen timeframe. One possible rule identifies a swing low when its low is below the lows of the two candles on either side. That makes the definition repeatable, but the swing becomes confirmed only after those later candles exist.
Do not mark every tiny fluctuation. Identify the larger moves that your entry timeframe can reasonably trade, then apply the same definition throughout your testing.
Pullback or trend change?
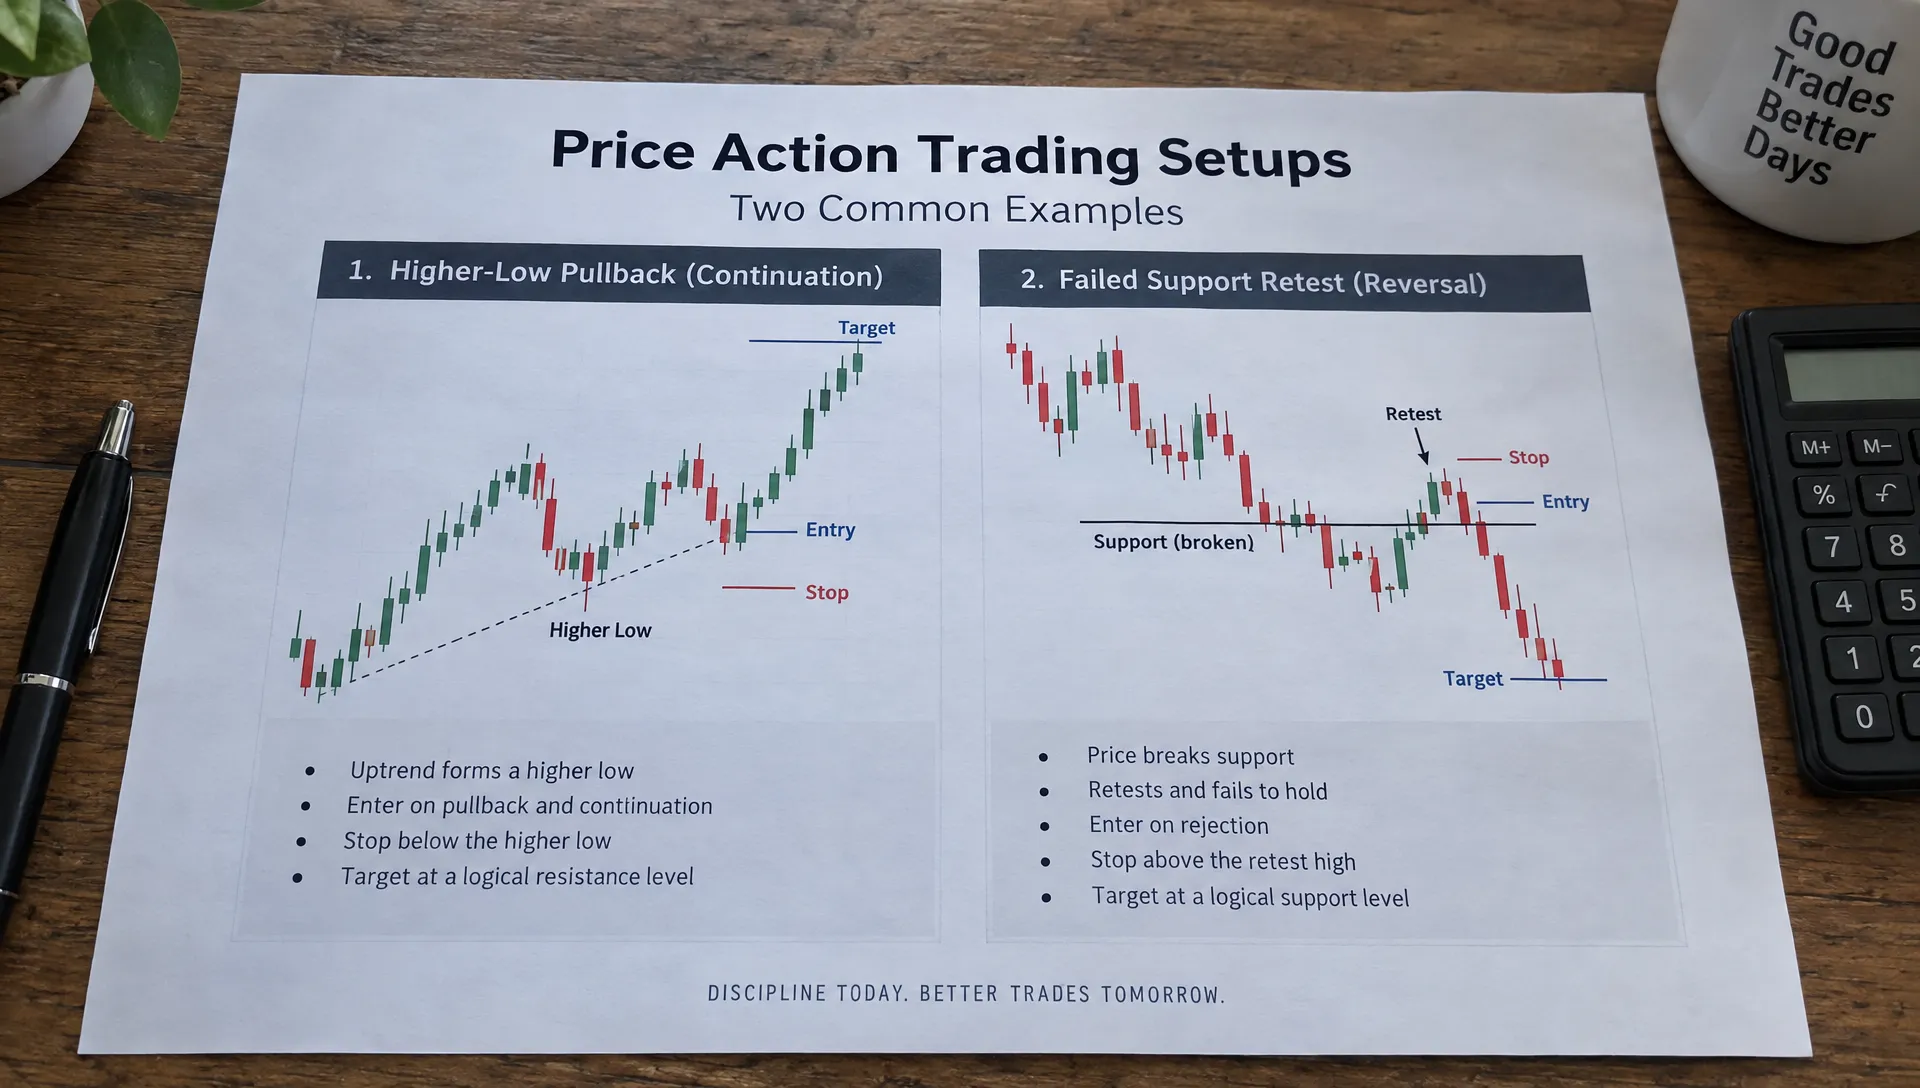
A pullback moves against the prevailing trend without yet invalidating its structure. In an uptrend, the most relevant low is often the swing low preceding the advance that broke the previous high.
Suppose price rises from $100 to $110, pulls back to $105 and advances to $116. A retreat toward $111 remains consistent with the uptrend. A break below $105 challenges that structure more seriously.
In price action trend trading, this distinction prevents an ordinary retracement from becoming an automatic reversal signal. A break of the relevant swing can invalidate the existing trend thesis, but it does not necessarily establish a new trend. A subsequent lower high and lower low provide stronger evidence of a downtrend.
Mark support and resistance as zones
Previous swing highs, swing lows and range boundaries are reference areas, not exact barriers. Price can briefly trade beyond a level before returning inside it.
Draw zones from observable turning points rather than adjusting them until every candle fits. Decide beforehand whether your rule requires an intrabar break, a closing break or a break followed by a retest.
A daily chart can establish context while a four-hour chart supplies an entry, but assign each a specific role. If you keep changing timeframes to find agreement, almost any trade can appear justified.
Three patterns worth defining precisely
Useful patterns describe behavior around structure. They are not standalone forecasts.
| Pattern | What to observe | What would weaken the setup |
|---|---|---|
| Pullback rejection | Price retreats into a relevant zone, then closes away from it | Price closes through the zone and fails to recover |
| Breakout and retest | Price clears a boundary, then revisits it without sustaining a move back inside | Price reenters the old range and remains there |
| Tight consolidation | Several overlapping candles form after a directional move | The consolidation breaks against the trend or offers insufficient reward |
For price action trend trading, a long wick at random is less informative than the same wick at a previously defined pullback zone. Even then, it shows rejection during that candle, not guaranteed continuation.
Avoid collecting dozens of named formations. One clearly defined setup is easier to test than a discretionary mixture of flags, engulfing candles and occasional breakouts. Record the setup's location, trigger and failure condition before deciding whether the candle looks convincing.
A price action trend trading plan with explicit rules
A workable plan needs a trend definition, entry condition, invalidation level and exit rule. It also needs conditions under which you do nothing.
For the following examples, prices are hypothetical and all reward calculations exclude costs. They illustrate decision-making, not historical results or recommended trades. Both setups require sufficient room to the next opposing level, and neither assumes that a stop order guarantees its specified execution price.
Worked example: buying a daily-chart pullback
Assume a stock advances from $100 to $110, pulls back to $105 and then reaches $116. It subsequently retreats to $111. A completed rejection candle has a low of $111, a high of $112 and a close of $111.80.
A predefined plan could be:
- Entry: Buy only if price trades through $112.10 after the rejection candle closes.
- Initial stop: Place the stop at $110.80, below the pullback low, making planned price risk $1.30 per share.
- Profit objective: Use the previous high of $116, offering $3.90 per share or 3R before costs.
- Cancellation: Cancel the unfilled setup after three daily candles or if price breaches the invalidation level first.
Here, 1R means the planned initial risk. The stop protects the specific pullback setup, not the entire uptrend: price could breach $110.80 while remaining above the larger $105 structural low.
That distinction matters in price action trend trading. You can be wrong about an entry without being wrong about the broader direction. Do not widen the stop toward $105 after entry merely to keep the trade alive.
Worked example: selling a failed breakout retest
Assume another instrument has declining swing highs at $72, $69 and $66, with recent support at $64. Price closes below $64, then returns to test that former support from underneath.
The retest candle reaches $64.20 and has a low of $63.50. A hypothetical short-entry trigger is $63.40, with a stop at $64.30 above the retest high. Planned risk is $0.90 per share.
If previously identified support sits at $61.60, that level offers $1.80 of potential reward, or 2R before costs. If meaningful support instead lies at $63, the available reward is much smaller and the setup may fail the plan's minimum requirement.
For price action trend trading, a breakout alone is not enough; the location of the next obstacle affects whether the trade is worth taking. Shorting also introduces borrow availability, borrow fees and potentially large losses. Do not assume that every instrument can be sold short on acceptable terms.
Size the position from the invalidation point
Choose the stop from the setup first, then calculate how many shares or units fit the risk budget. Reversing that order often leads to arbitrary stops.
The basic calculation is:
Position size = planned dollar risk ÷ price risk per unit.
With a hypothetical $20,000 account and a self-imposed risk limit of 0.5%, the planned risk budget is $100. Using the long example's $1.30 stop distance gives a maximum of 76 whole shares before allowing for costs. Their planned price risk is $98.80.
The 0.5% figure is an illustration, not a universally appropriate risk level. Commissions, slippage and gap risk can push the realized loss beyond that calculation. Reserve room for costs rather than treating the entire budget as available price risk.
Also check exposure across positions. Several technology stocks can fall together, so five individually small trades may create a concentrated portfolio bet. A stop on each position does not eliminate their shared risk.
For context when researching individual holdings, Upside's Visa stock profile combines security information with community ownership data. That can inform portfolio research, but it does not replace checking current liquidity, execution conditions or your own concentration.
Account for spreads, slippage and scheduled news
A chart displays price history, not your guaranteed execution. The bid-ask spread creates an immediate trading cost, while slippage can make entries or exits worse than planned. These effects matter especially when the stop distance is small.
The SEC's Investor.gov explanation of market, limit and stop orders clarifies an essential distinction: a stop price is a trigger, not a guaranteed fill price. A stop-limit order controls the acceptable execution price but may remain unfilled.
For price action trend trading, scheduled earnings, economic releases and market openings deserve explicit rules. Decide whether to avoid new entries around them, close positions beforehand or accept and budget for event exposure. A visually orderly chart can gap through an invalidation level.
Fee awareness extends beyond markets: poker rakeback and cashback offers return part of players' fees, illustrating why gross outcomes and net outcomes differ. In trading, lower execution costs likewise improve the arithmetic, but they cannot create a profitable strategy by themselves.
Choose instruments with execution conditions you can measure. Stocks, forex and crypto have different trading sessions, financing arrangements and liquidity patterns. A setup tested on daily stock charts should not be assumed to work unchanged on five-minute crypto charts.
Test the rules without fitting them to hindsight
Write the setup before reviewing outcomes
Document what counts as a trend, which swing defines invalidation and exactly when an order becomes eligible. Specify the entry buffer, stop placement, target rule and cancellation conditions.
Include no-trade filters, such as an opposing level being too close or a scheduled announcement occurring before entry. Avoid conditions like “strong-looking trend” unless you can translate them into observations another person could reproduce.
Testing price action trend trading requires particular care with timing. A swing defined using two candles to its right cannot be used as confirmed information before those candles finish. Likewise, a candle's closing pattern cannot justify an earlier entry within that same candle.
Separate development from evaluation
Use one chronological sample to develop the rules, another to check reasonable adjustments and a final untouched sample for evaluation. This reduces the temptation to select rules because they fit an already familiar chart.
Test across rising, falling and sideways conditions. Then assess other instruments or timeframes separately rather than pooling everything into one attractive average. For stock tests, account for corporate actions and avoid evaluating only companies that survived or performed well.
If both the stop and target fall within one historical candle's range, basic OHLC data may not reveal which occurred first. Use finer data or a conservative assumption, and disclose the choice.
Measure net expectancy and drawdown
Track win rate, average win, average loss, costs and drawdown. Also record missed fills and deviations from the rules.
A hypothetical strategy winning 40% of trades at an average 2R and losing 60% at 1R has expectancy of 0.2R per trade before costs. Average costs of 0.25R would turn that into negative expectancy of 0.05R.
Price action trend trading should therefore be evaluated on net results, not on a collection of impressive chart examples. Report the number of observations and the range of outcomes. Paper trading can then check whether the rules are executable, though simulated fills may be more favorable than live ones.
Benefits and limitations of a clean-chart approach
The main benefit is clarity. You can connect an entry, stop and target to visible market structure without reconciling several overlapping signals. That makes trade review more concrete: either the setup met the rules or it did not.
The approach also has limitations. Sideways markets can produce repeated false breaks. Different traders can interpret the same structure differently, and confirmation often arrives only after price has already moved. Removing indicators does not remove lag, uncertainty or behavioral mistakes.
Price action trend trading is most useful as a defined execution framework, not a complete explanation of an asset's value. Earnings, valuation, liquidity and portfolio exposure still matter to investors, even when none of them appears in a candle pattern.
Maintain a distinction between an actively traded position and a long-term holding. Changing a failed trade into an investment after the stop is reached makes both strategies harder to evaluate.
Frequently asked questions
Which timeframe is best for trading price action? There is no universally best timeframe. Daily and four-hour charts can reduce decision frequency compared with very short-term charts, but they can involve larger price swings and overnight exposure. Select a timeframe you can monitor consistently, then test its execution costs and rules.
Can you trade trends without moving averages or volume indicators? Yes. Swing highs, swing lows, candle closes and horizontal price zones can define a complete setup. Whether that setup has positive expectancy is a separate question that requires testing.
How can you tell whether a pullback is becoming a reversal? Watch the structural swing supporting the trend. Its failure challenges the original thesis; a subsequent opposite sequence of swings strengthens the reversal case. Neither observation provides certainty.
Can price action trend trading provide reliable daily income? No strategy guarantees daily income. Valid setups may not appear every day, and losing streaks can occur even with positive long-run expectancy. A daily profit quota can encourage trades that do not meet the plan.
Should you always target twice the initial risk? No. A reward-to-risk threshold is a rule to test, not a universal law. A distant target is not useful if the market rarely reaches it. Evaluate the target together with win rate, costs and drawdown.
Keep trade execution separate from portfolio intelligence
Start with one setup, one market and one timeframe. Record the thesis before entry, respect the invalidation rule and review results after costs before increasing exposure.
To complement that process, explore Upside for verified investor holdings, anonymous portfolio comparisons and sector or theme discovery. These can add context to your allocations, but other investors' positions are not proof that a chart setup will work. Use portfolio intelligence to ask better questions, not to override your risk limits.