Reading the Gold Intraday Trend Around Economic Releases
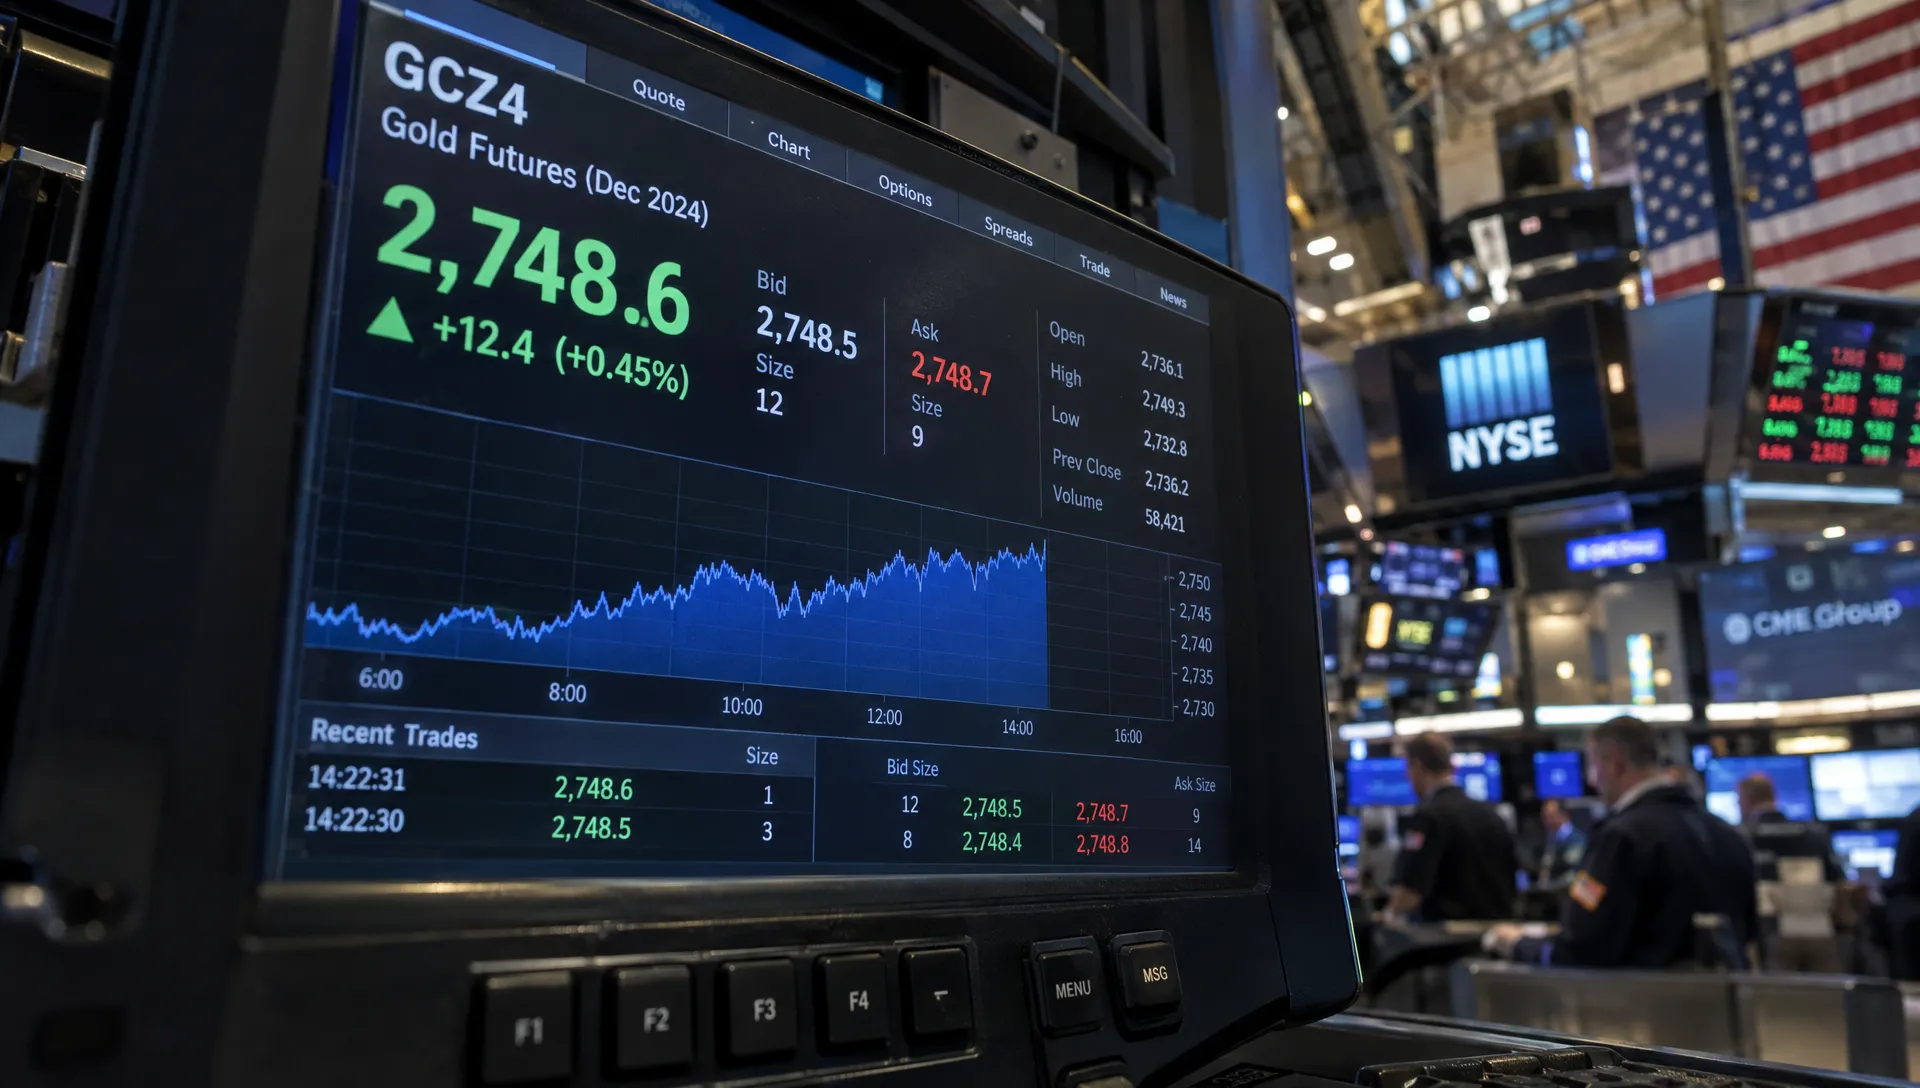
Reading the gold intraday trend around an economic release means separating a lasting change in direction from a few seconds of forced buying or selling. Gold can jump on an inflation headline, reverse as traders read the details and then settle into a different pattern once Treasury yields respond.
For retail investors, the useful question is not simply whether the number was “good” or “bad.” It is whether the release changed interest-rate expectations and whether price can hold the levels it just crossed.
This guide provides a repeatable framework for preparing before a release, confirming direction afterward and limiting execution risk. It is an educational process, not a live XAU/USD call or a promise that waiting for confirmation eliminates losses.
What a gold intraday trend actually tells you
An intraday trend is a directional pattern within a defined trading session. Rising swing highs and rising swing lows indicate an upward structure. Falling highs and falling lows indicate a downward structure. Overlapping swings usually suggest a range rather than a reliable directional move.
The session definition matters. A chart beginning at midnight in your broker’s time zone can produce different reference levels from one organized around the futures trading day or New York activity.
Around economic releases, distinguish three separate observations:
- Initial reaction: The immediate price jump as orders respond to the headline.
- Acceptance: Price continues trading beyond a reference level rather than immediately returning inside it.
- Follow-through: Subsequent swings extend the move and pullbacks preserve its structure.
A large candle proves that price moved quickly. It does not, by itself, establish acceptance or follow-through. That distinction prevents a news spike from becoming an unsupported directional forecast.
Identify which part of the release changes expectations
The gold intraday trend often reflects a chain of adjustments: economic surprise, expected Federal Reserve policy, Treasury yields, the dollar and then gold positioning. The sequence is not always clean, and several markets may react simultaneously.
| Release | Details worth checking | Potential transmission to gold |
|---|---|---|
| Consumer Price Index | Headline and core readings, monthly changes and composition | Inflation and policy expectations can shift yields and the dollar |
| Employment Situation | Payrolls, unemployment, wages and prior-month revisions | Labor-market strength can change expectations for interest rates |
| Personal Income and Outlays | PCE inflation details and spending | Inflation persistence and demand can affect policy pricing |
| FOMC decision | Statement, projections when published and press conference | Changes in the expected policy path can trigger several distinct moves |
Use the BLS CPI release schedule and the Federal Reserve’s FOMC calendar to verify dates and times. Many major US releases arrive at 8:30 a.m. Eastern Time, but never assume every event follows that schedule.
Compare actual results with a timestamped consensus estimate, not merely the previous reading. Consensus estimates come from surveys or data providers, not from the statistical agency publishing the release.
Separate inflation evidence from shopping anecdotes
Apparel illustrates the difference between a price and an inflation measure. Browsing apparel listings at Lenovra shows individual retail asking prices, not a representative measure of changing consumer prices. CPI aggregates observations across a broad basket using a defined methodology.
For trading purposes, an isolated discount or expensive purchase cannot establish whether the official release will exceed expectations. Read the published figures, their components and any revisions instead.
A hotter inflation reading also does not mechanically imply higher gold prices. If markets price tighter policy and real yields rise, gold may fall despite inflation being elevated.
Choose the instrument before choosing the chart
Your gold intraday trend assessment should identify the actual product being observed. XAU/USD, COMEX futures and a gold exchange-traded fund are related exposures, but their prices, trading hours and execution conditions are not interchangeable.
Spot gold and broker feeds
Spot gold trades through an over-the-counter market. Retail XAU/USD charts commonly reflect a broker’s pricing feed or derivative product rather than a single consolidated exchange price.
A level visible on one feed may differ slightly on another. Spread widening can also make an apparent breakout executable at a much worse price than the chart suggests.
Futures and gold funds
COMEX gold futures provide exchange-traded prices and contract-specific volume. Identify the contract month and check liquidity before using its signals. Futures prices can differ from spot because of financing, storage and time to delivery.
Continuous futures charts introduce another complication: contract rolls and price adjustments can alter historical levels. Validate a trading level against the contract you would actually trade.
Gold funds trade within their applicable exchange hours and can experience premiums, discounts and fund-specific flows. Their volume measures activity in the fund, not total global gold trading.
Build a timeframe hierarchy before the announcement
Use a higher timeframe to establish context, a middle timeframe to judge acceptance and a lower timeframe only if needed for execution.
A practical starting point is a one-hour chart for the broader structure, a 15-minute chart for session levels and a five-minute chart for post-release confirmation. These are working choices, not universally optimal settings.
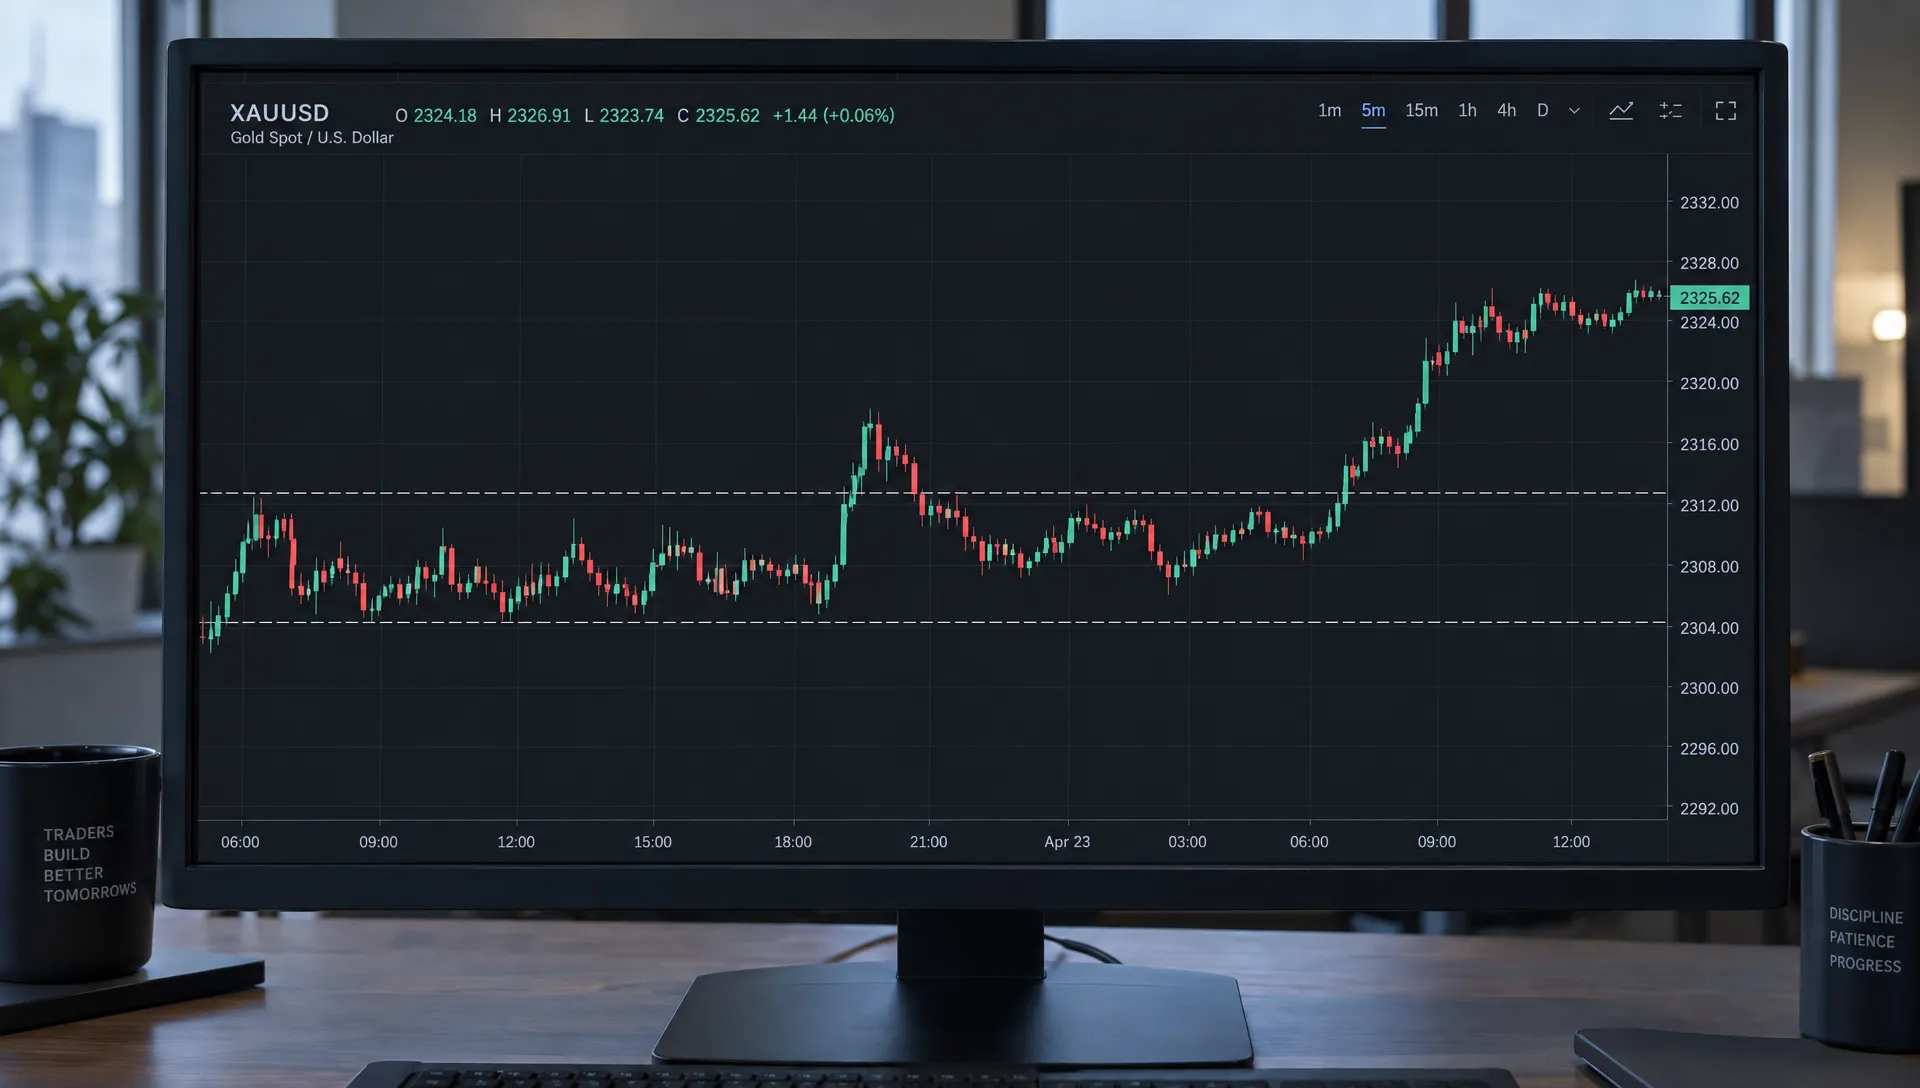
Mark the prior session’s high and low, the current session’s extremes and the range immediately preceding the release. Add a higher-timeframe level only if it could realistically matter during the session. Too many lines make almost every move look significant.
The gold intraday trend can disagree with the daily trend. A morning decline may simply be a pullback within a larger advance. Label both rather than forcing them into one forecast.
Liquidity conditions also change through the day. London and New York activity, particularly their overlap, often provide active trading conditions. Holidays, major announcements and contract transitions can override that usual pattern.
Write down your chart time zone. US daylight-saving changes can otherwise shift how an event appears relative to overseas sessions.
Use indicators as supporting evidence
Indicators can organize observations, but stacking several versions of the same price calculation does not create independent confirmation.
VWAP needs a defined session and relevant volume
Volume-weighted average price can help show whether an exchange-traded contract is trading above or below its session’s average transaction price, weighted by volume.
Its meaning depends on the inputs. Futures VWAP should use volume from the relevant futures contract. A broker’s spot-gold “volume” may be tick activity rather than consolidated traded volume. A fund’s VWAP describes that fund’s activity.
An anchored VWAP beginning at the release can be useful, but it answers a different question from a full-session VWAP. Record which one you use.
Moving averages and momentum remain secondary
A moving-average slope can summarize direction, while RSI can describe momentum. Both may lag after a sharp announcement-driven move. An overbought reading does not automatically invalidate an uptrend.
For the gold intraday trend, prioritize swing structure and level acceptance, then use one or two indicators to check consistency. If price holds above a breakout level while a relevant VWAP rises, the evidence is stronger than an indicator crossover alone.
Treasury yields and the dollar provide a separate cross-check. Falling yields and a weaker dollar can support a bullish interpretation, but safe-haven demand can sometimes lift gold and the dollar together.
Distinguish a valid move from a news spike
Before the event, define what acceptance would look like. One possible rule is a completed five-minute close beyond the pre-release range followed by a pullback that holds outside it. Another might require two completed closes. Neither rule is inherently superior without testing.
The purpose is consistency: decide before the candle appears, not after seeing whether the trade would have won.
Warning signs include a long wick followed by a close back inside the range, repeated crossings of the same level or a move that disappears when spreads normalize. A return inside the range weakens the breakout thesis, although it does not guarantee a reversal.
The gold intraday trend becomes more credible when the next swing extends the move without breaking the pullback structure that supports it. Cross-market behavior should be broadly understandable, even if it is not perfectly aligned.
FOMC days require particular care. The statement and the press conference are separate information events. A move that survives the statement can still reverse when the chair discusses the policy outlook. Treat the next scheduled communication as fresh event risk.
Turn the reaction into three conditional scenarios
A useful plan describes what would change your view. Consider this fictional example, using a pre-release range of $3,000 to $3,010 per ounce. These are illustrative prices, not current market levels.
| Scenario | Evidence to watch | What weakens or invalidates it |
|---|---|---|
| Bullish continuation | Price closes above $3,010, then a pullback holds that boundary | Sustained trading back inside the range or a break of the supporting swing low |
| Bearish continuation | Price closes below $3,000, then fails to reclaim it | Acceptance back inside the range or a break above the supporting lower high |
| Unresolved range | Breakouts fail and price repeatedly returns between the boundaries | A later breakout that meets the predefined acceptance rule |
The range case is a legitimate outcome, not an analytical failure. If the release produces conflicting information, staying neutral may be more defensible than forcing a trade.
Keep analytical invalidation separate from an executable stop. Your thesis may require a completed close to change, but a leveraged position still needs an exposure limit that does not depend on waiting indefinitely for that close.
Choose between continuation and failed-breakout setups
Continuation after a pullback
A continuation approach waits for a break, evidence of acceptance and a pullback toward the broken boundary. Its advantage is a clearer invalidation reference than entering during the first surge.
The trade-off is that strong moves sometimes never retest. Missing those moves is part of the method. Chasing far from the planned entry changes both the risk and the strategy.
Failed breakout back into the range
A failed-breakout approach looks for an attempted break that cannot hold, followed by acceptance back inside the prior range. It is not simply selling because gold has risen quickly or buying because it has fallen.
For example, an upside spike that returns below the range high and then fails to reclaim it may support a bearish scenario. That scenario weakens if price recovers the high and begins holding above it again.
Either approach should express a specific gold intraday trend hypothesis. Avoid switching from continuation to reversal merely because the first position loses. A new setup needs its own evidence, entry conditions and risk budget.
Size risk for the instrument and execution conditions
Around releases, spread, slippage and order handling can matter as much as directional accuracy. A stop order does not guarantee execution at the stop price, and a stop-limit order may not execute at all.
A basic sizing relationship is:
Position size = planned dollar risk ÷ estimated loss per unit at the stop.
Estimated loss should include the price distance, the instrument’s monetary multiplier and a reasonable allowance for transaction costs and adverse execution. Actual losses can still exceed that estimate during fast markets.
For example, suppose a hypothetical $20,000 account allocates $50 to one trade. A standard COMEX Gold futures contract represents 100 troy ounces, so a $4-per-ounce adverse move equals $400 before costs. A Micro Gold contract represents 10 ounces, making the same move $40 before costs. Check the exchange’s current specifications and your broker’s terms before trading.
If an illustrative $15 allowance for fees and adverse execution raises the micro-contract estimate to $55, even one contract exceeds the planned budget. The answer is to skip the trade or use a suitable smaller exposure, not tighten the stop arbitrarily.
A correct gold intraday trend reading can still produce a losing trade through poor entry location or execution. Set a maximum session loss and a limit on repeated attempts so that several small failures do not become an uncontrolled position.
Follow a repeatable release-day routine
Before the event
Confirm the official release time, instrument, contract and chart time zone. Record consensus estimates and identify other announcements arriving at the same time. Mark your levels and write bullish, bearish and neutral conditions.
Check spreads and order behavior under ordinary conditions. Decide whether you will remain flat during the release itself. That decision should reflect your tested method and risk capacity, not confidence in predicting the number.
After the first reaction
Read the main figures, important components and revisions. Observe how yields and the dollar respond, then check whether gold meets your acceptance rule. Do not treat a temporarily frozen quote or an unusually wide spread as clean price discovery.
Update the gold intraday trend assessment only when its stated conditions change. A brief countertrend candle should not automatically overturn a plan, while a clear invalidation should not be dismissed as noise.
After the session
Save the pre-release plan alongside the actual chart. Record entry, exit, maximum adverse movement, spread and slippage. Separate mistakes in interpretation from mistakes in execution.
When testing the method, include losing releases, no-trade sessions, commissions and realistic fills. Candle-based backtests that assume execution at the displayed price can overstate results during news events.
Frequently asked questions
What is the gold intraday trend today? A current assessment requires live prices, a specified instrument and a timestamp. Without those, a bullish or bearish label could be stale or refer to a different session. Start with current swing structure and the latest release reaction.
How long should I wait after an economic release? There is no universal waiting period. Use a predefined condition, such as a completed candle and a held retest, rather than assuming that a fixed number of minutes makes execution safe.
Does higher inflation always push gold higher? No. Higher-than-expected inflation can lift yields and strengthen the dollar if traders expect tighter monetary policy. Gold’s response depends on how those forces interact with positioning and demand.
Can futures volume confirm a spot-gold move? It can provide related evidence, but it is not consolidated spot volume. Match timestamps, identify the active contract and account for differences between futures and spot pricing.
Can portfolio holdings confirm an intraday signal? Holdings can reveal allocation preferences, but they generally cannot establish the timing or cause of a minute-by-minute move. They serve a different purpose from an event-driven trading signal.
Keep short-term signals separate from portfolio decisions
A release-driven move may matter to an active trader without justifying a change to a long-term allocation. Before acting, distinguish a tactical position from a strategic gold holding and consider your total exposure.
For that broader perspective, compare verified investor portfolios on Upside Invest. Anonymous allocation comparisons can add context to portfolio decisions, but they are not a substitute for live market data, execution controls or a clearly defined risk limit.