Use a Stock Screener for Institutional Ownership Research
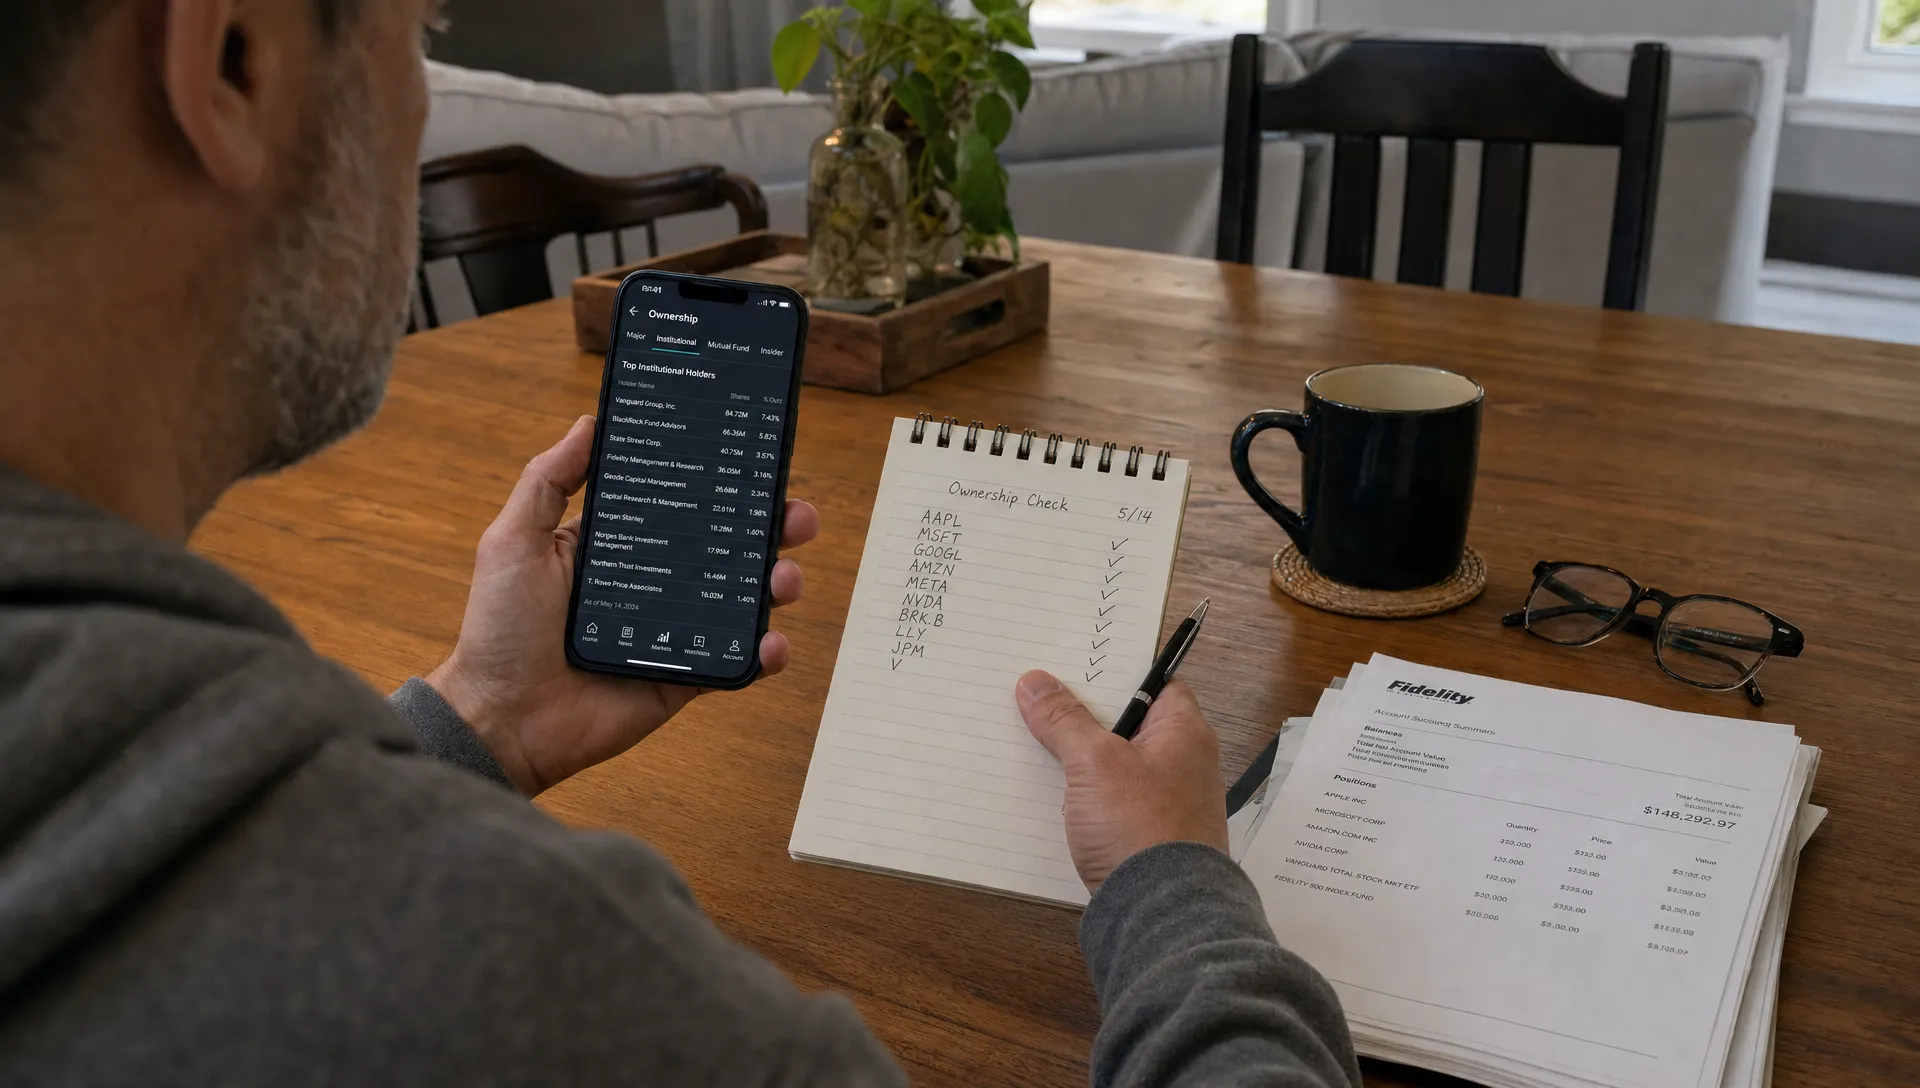
Institutional ownership can add useful context to a stock idea, but it is easy to misuse. A high percentage can look like validation, a low percentage can look like neglect and a sudden change can look like a signal. In reality, each of those readings depends on float, filing delays, passive fund ownership, liquidity and the type of institution involved.
That is where a stock screener helps. Instead of checking ownership data one ticker at a time, you can define the kind of institutional behavior you want to study, narrow the market to a manageable list and then verify the signal before it influences your investment decision.
A stock screener institutional ownership workflow works best when it is treated as a research funnel, not a trade trigger. The goal is to find questions worth answering: Who is buying? Is ownership rising for a reason? Is the stock crowded? Are institutions building conviction or merely tracking an index?
What institutional ownership can tell you
Institutional ownership generally refers to shares held by professional investors such as mutual funds, pension funds, hedge funds, banks, insurance companies and registered investment managers. In the US, much of the public data comes from SEC filings, especially Form 13F, which is filed quarterly by institutional investment managers with at least $100 million in certain securities under management.
That data can help you spot patterns that retail investors might miss. If a small-cap company begins attracting new long-only managers, the market may be recognizing improving fundamentals. If a previously popular stock loses several active holders, the risk narrative may be changing. If nearly all available float is already institutionally owned, there may be limited room for incremental institutional demand.
The headline number alone is not enough. A company with 85 percent institutional ownership can still be risky if the ownership is mostly passive funds, stale filings or a concentrated group of holders that may all react similarly during stress. If you need a deeper primer on interpreting the raw percentage, Upside has a separate guide on how to read institutional ownership of a stock.
Set up the right filters before you screen
The best stock screener institutional ownership filters are not always the most obvious ones. Many investors start with total institutional ownership, then stop. A better approach is to combine level, direction and quality of ownership.
Use the screener to capture several dimensions at once:
- Institutional ownership percentage, to see how much of the company is held by professional investors.
- Quarter-over-quarter ownership change, to identify accumulation or distribution.
- Number of institutional holders, to separate broad sponsorship from concentrated ownership.
- New institutional positions, to find fresh interest.
- Top holder concentration, to understand dependence on a few large investors.
- Float-adjusted ownership, to avoid being misled by insider holdings or locked-up shares.
A simple filter might look for US-listed companies with market caps above $500 million, institutional ownership between 20 percent and 70 percent, rising ownership over the last reported quarter and average daily trading volume above a minimum threshold. That type of setup avoids some extremes: tiny illiquid stocks where the data can be distorted and mega-cap index names where institutional ownership is high by default.
For more advanced screening, separate your universe by market cap. Institutional ownership behaves differently in micro-caps, mid-caps and large-caps. A 15 percent institutional stake in an emerging small-cap may be meaningful, while the same level in a large-cap could suggest the stock is outside the mainstream institutional universe for a reason.
A practical stock screener institutional ownership workflow
A good screen should move from broad to specific. Start with the universe, apply ownership filters, then layer in fundamentals and price behavior. This keeps you from confusing institutional activity with investment quality.
| Screening layer | What to check | Why it matters |
|---|---|---|
| Universe | Exchange, market cap, liquidity and sector | Prevents distorted results from illiquid or unsuitable stocks |
| Ownership level | Total institutional ownership and float-adjusted ownership | Shows how much professional capital is already involved |
| Ownership change | Quarterly change, new buyers and position exits | Helps identify direction of sponsorship |
| Holder quality | Active managers, passive funds and concentration | Separates conviction from index exposure |
| Fundamentals | Revenue growth, margins, debt and valuation | Confirms whether ownership changes have a business case |
| Risk context | Short interest, insider selling and volatility | Highlights signals that may conflict with institutional buying |
Once the list is filtered, sort it multiple ways. Sorting only by the highest institutional ownership usually pushes you toward large, widely owned names. Sorting by recent ownership increase can surface more interesting opportunities, especially if the company is still underfollowed.
The strongest candidates often combine moderate institutional ownership with rising active sponsorship, improving fundamentals and enough liquidity for funds to keep building positions. The weakest candidates often show high ownership but declining fundamentals, heavy concentration or ownership that appears tied to passive index inclusion rather than fresh analysis.

Read the patterns your screen reveals
Use a stock screener institutional ownership screen to find patterns, then interpret those patterns in context. Four setups are especially common.
First, rising ownership from a low base can indicate that institutions are discovering a company. This may be relevant for smaller companies, turnaround stories or firms entering a new index. The key question is whether the new ownership is active and thesis-driven or simply mechanical.
Second, high and rising ownership can reflect strong consensus. This often appears in companies with high quality earnings, consistent growth or strong sector tailwinds. The risk is crowding. If expectations are already high, even a decent earnings report may not be enough to support the stock.
Third, falling ownership can point to deteriorating confidence, but it can also reflect portfolio rebalancing, mandate changes or tax-loss selling. Do not assume every decline is a warning sign. Check whether the selling is broad-based, concentrated among a few funds or connected to a known catalyst.
Fourth, mixed ownership signals deserve extra work. A stock may show rising total institutional ownership while active managers are reducing exposure and passive funds are increasing. That is a very different story than broad active accumulation.
This is also where sector knowledge matters. For example, if institutions are buying a retail company, the thesis may involve margin recovery, store productivity, digital conversion or better customer experience. Understanding the operating drivers behind retail transformation, including AI-enabled e-commerce, performance optimization and analytics from firms such as retail digital transformation specialists, can help you judge whether the market’s expectations are tied to real business improvements or just a broad theme.
Verify ownership data with filings
A screener is only the starting point. Institutional ownership data can be delayed, incomplete or calculated differently across platforms. Form 13F data is usually filed up to 45 days after quarter-end, which means the position may already have changed by the time you see it. Some filings also do not show short positions, derivatives exposure or the full intent behind a holding.
After your screen creates a shortlist, verify the names that matter most. Check recent 13F filings for large holders, Schedule 13D or 13G filings for major beneficial ownership and Form 4 filings for insider activity. If there is a large ownership change, identify whether it came from one holder or many. A broad increase across several active managers usually means something different from one large fund initiating a position.
Upside has a detailed guide on finding stock ownership changes in SEC filings if you want to trace ownership movements back to the underlying documents.
Verification also helps you catch stale or misleading screen results. A screener might show a high ownership percentage because the share count changed, the float contracted or a large holder’s old position remains in the dataset. When the signal is central to your thesis, confirm it manually.
Combine ownership with portfolio context
Institutional ownership is more useful when compared with your current portfolio. If your screen finds several stocks with rising institutional sponsorship, ask whether they all share the same factor exposure. You may think you are diversifying across companies but actually adding one concentrated bet on software, small-cap momentum, AI infrastructure or interest rates.
This matters because institutional flows often cluster around themes. When funds rotate into a sector, many stocks can show improving ownership at once. Some will have strong company-specific reasons. Others may simply move with the group. Your job is to separate company conviction from theme exposure.
A practical review should include correlation, sector weight, valuation and your existing holdings. If the screened stock would add the same risk you already own, the ownership signal may be less valuable. If it adds a differentiated exposure with improving sponsorship and strong fundamentals, it may deserve deeper research.
Common mistakes when screening institutional ownership
The most common mistake is assuming more institutional ownership means safer ownership. It does not. Institutions can be wrong, crowded trades can unwind quickly and passive ownership can rise without any investor making a fresh judgment about the company.
Another mistake is ignoring float. If insiders control a large percentage of shares, institutional ownership as a percentage of total shares may understate how much of the tradable float institutions effectively control. The reverse can also happen when dilution, secondary offerings or buybacks change the share count.
Investors also overreact to one quarter of data. A single quarter of buying can be noise. Two or three quarters of accumulation, especially across several active managers, is more meaningful. Even then, ownership should support the thesis, not replace it.
Finally, avoid using institutional ownership in isolation from valuation. A stock can have excellent sponsorship and still be priced for perfection. A screen can tell you where professional capital is moving. It cannot tell you what return is already embedded in the price.
Where Upside Invest fits in the process
A traditional screener helps you filter the market. Upside Invest adds another layer by showing what verified investors are buying, holding and outperforming with real portfolio data while preserving privacy through anonymous profiles.
That can be useful after your initial screen. You can compare your portfolio, review investor holdings, track trends and momentum, study top performer rankings and explore sector or theme exposure across stocks, funds and crypto. Instead of treating institutional filings as the only source of market intelligence, you can compare them with how verified investors are positioned in practice.
A good stock screener institutional ownership process does not end with a list of tickers. It ends with a better research queue, clearer questions and a stronger sense of whether a stock fits your portfolio.
Frequently Asked Questions
What is institutional ownership in a stock screener? Institutional ownership is the percentage of a company’s shares held by professional investors such as mutual funds, hedge funds, pension funds, banks and investment managers. In a screener, it is usually shown as a percentage of shares outstanding, though some platforms also provide ownership changes, holder counts and recent buying or selling.
Is high institutional ownership always good? No. High institutional ownership can reflect confidence, but it can also mean the stock is crowded, heavily owned by passive index funds or vulnerable if large holders reduce exposure. Always compare ownership with fundamentals, valuation, float and recent ownership changes.
How often is institutional ownership data updated? Many US institutional ownership datasets rely on quarterly Form 13F filings, which are filed up to 45 days after quarter-end. Some platforms update faster when other filings appear, but the data can still lag current positions.
What is a good institutional ownership percentage? There is no universal good percentage. For a large-cap stock, high institutional ownership may be normal. For a smaller company, moderate but rising institutional ownership may be more informative. The direction, holder type and float-adjusted context matter more than the raw number.
Should I buy a stock just because institutions are buying? No. Institutional buying can help validate a research idea, but it should not be the full thesis. Use it alongside business quality, valuation, balance sheet strength, insider behavior, price momentum and your own portfolio risk.
Turn ownership screens into better portfolio decisions
If you already use screeners, add a verification step and a portfolio step before acting. Look beyond the headline percentage, confirm the filings and ask whether the stock improves your portfolio or simply repeats a risk you already own.
With Upside Invest, you can pair ownership research with verified investor holdings, portfolio comparison, trend tracking and anonymous community benchmarking, helping you move from raw data to more informed investment decisions.