What a Sideways Trend in Forex Means for Breakout Traders
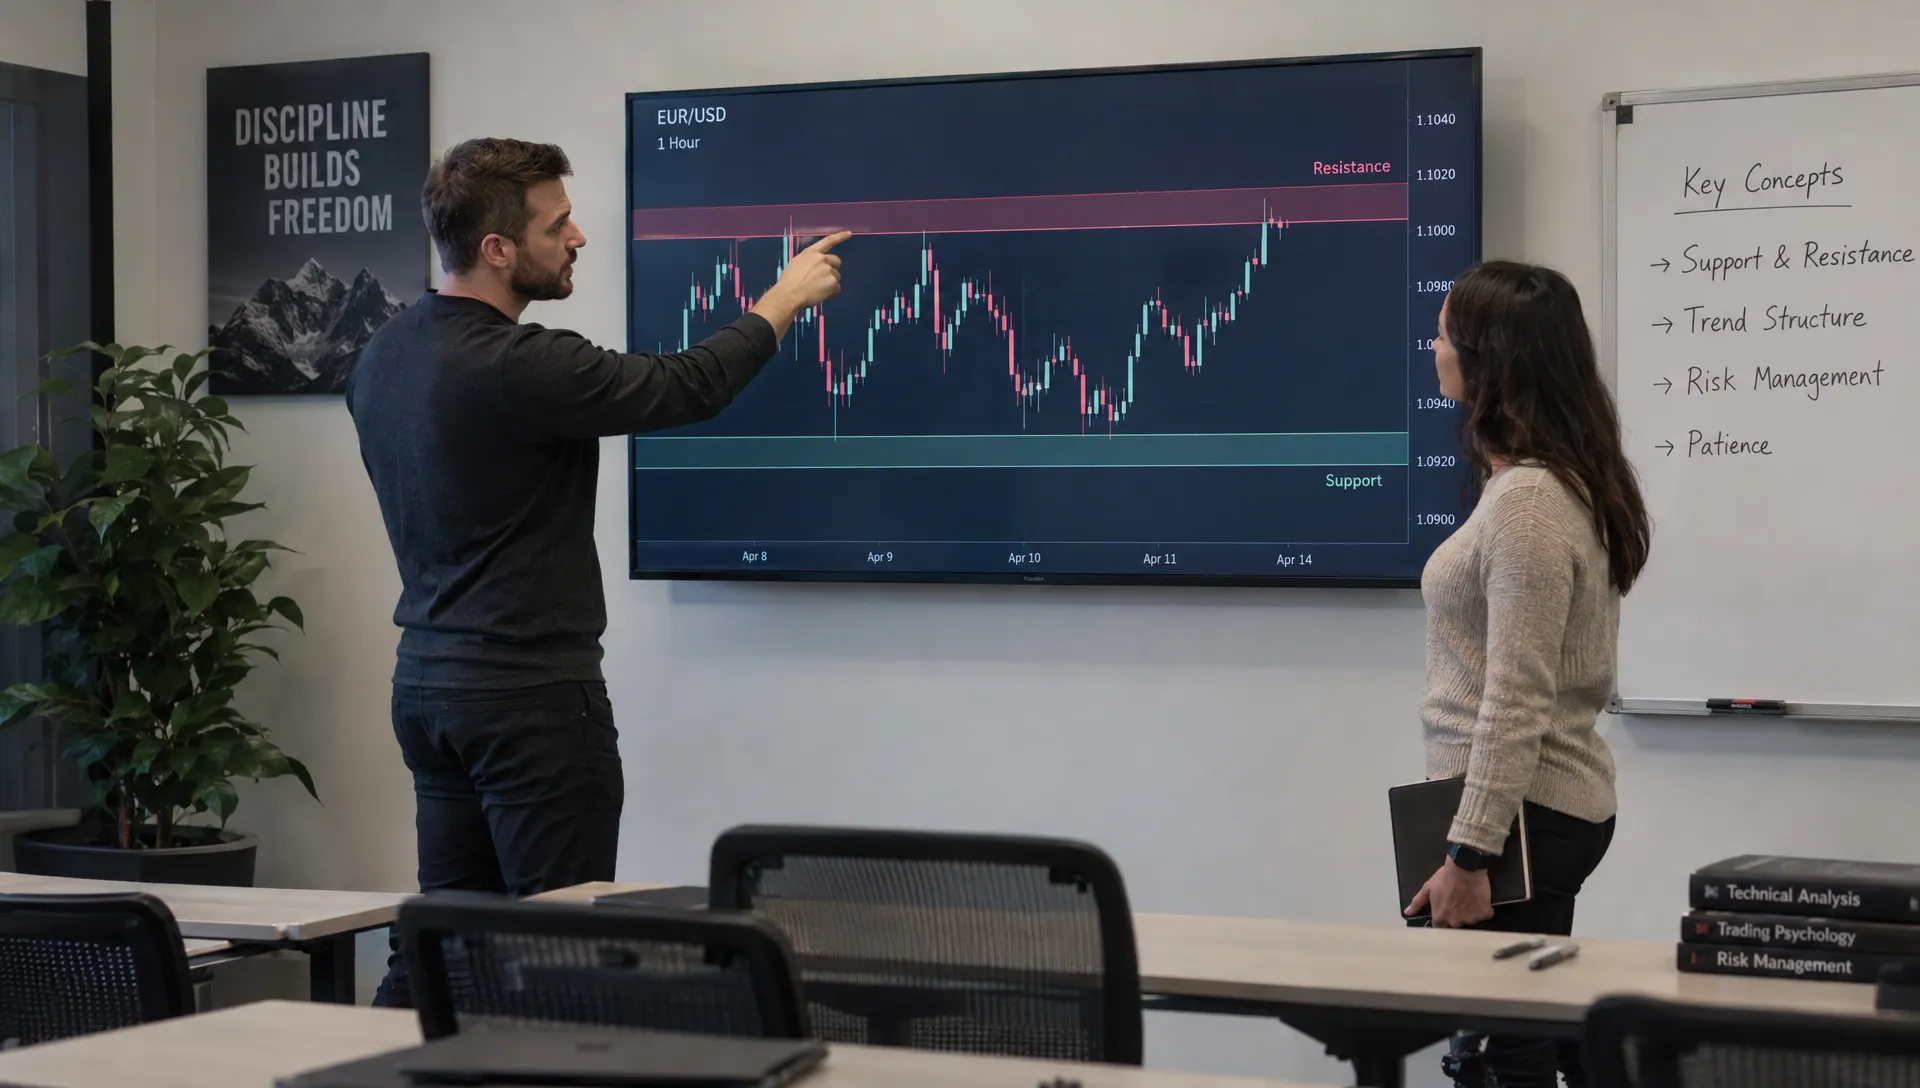
A sideways trend forex traders see on a chart is a period when a currency pair moves between support and resistance without sustaining an upward or downward move. For breakout traders, that creates a decision: prepare for a move beyond the range, trade its boundaries or leave the pair alone.
A range is a market condition, not a promise of an imminent breakout. The useful question is whether you can define its boundaries, recognize a meaningful break and control the cost of being wrong.
What a sideways market means for breakout traders
In a directional trend, price generally produces higher highs and higher lows, or lower highs and lower lows. In a sideways market, those sequences fail to persist. Buyers repeatedly appear near a lower area while sellers repeatedly appear near an upper area.
Those areas are support and resistance zones, not exact prices. A currency pair can briefly move through a previous high without establishing a new trend. Treating every small breach as a breakout invites repeated losses.
Consolidation can follow a strong move, develop ahead of economic news or simply reflect balanced buying and selling. It does not reliably reveal whether the next sustained move will be upward or downward.
For breakout traders, the opportunity is the potential transition from balance to direction. Until that transition occurs, the range remains the working assumption.
How to identify a sideways trend forex traders can measure
Start with price structure rather than an indicator. A practical range definition should specify the chart timeframe, observation window and conditions that invalidate it.
For example, an illustrative screening rule could require at least two separated reactions near each boundary over the previous 40 completed candles, with substantial overlap between intervening swings. Those numbers are starting points for testing, not proven settings.
Draw zones around clusters of reactions rather than forcing a line through one extreme wick. If each boundary needs constant redrawing to preserve the pattern, the range may be too ambiguous to trade.
Indicators can support that assessment:
- Average True Range (ATR): Measures recent movement, including gaps, but does not indicate direction. Falling ATR can support a consolidation diagnosis.
- Bollinger Band width: Contracting bands indicate lower recent volatility, not the direction or timing of the next breakout.
- Average Directional Index (ADX): Measures trend strength. Readings below 20 are a common weak-trend heuristic, not a universal trading signal.
A sideways trend in forex is more convincing when price structure and volatility measures agree. No indicator makes poorly defined boundaries reliable.
Adjust for the currency pair and timeframe
An hourly range can sit inside a strong daily trend. An upside breakout on the hourly chart might therefore be only a countertrend rally on the daily chart.
Before trading, inspect a higher timeframe for nearby barriers. A clean-looking breakout has less room to develop if it immediately encounters a major daily resistance zone.
Volatility also needs context. Compare current ATR or band width with the same pair's history on the same timeframe, ideally accounting for the trading session. Raw pip measurements are not directly comparable across all pairs.
| Context | What to check | Why it matters |
|---|---|---|
| Different currency pair | Pip convention, typical movement and spread | Identical-looking ranges can have different execution costs |
| Different timeframe | Higher-timeframe trend and nearby zones | A local breakout may not change the broader direction |
| Different session | Current spread and usual activity | Quiet-session consolidation can behave differently when participation increases |
Why quiet ranges can be expensive to trade
A narrow range can make risk appear small while leaving little room to absorb trading costs. If your intended profit is six pips and the spread is two pips, the spread alone consumes a substantial part of the opportunity before commissions or slippage.
Repeated attempts compound that problem. Buying every move above resistance can produce several small losses before a sustained move appears, if one appears at all.
The sideways trend forex traders see before a scheduled release can also disappear abruptly. Inflation reports, employment data and central-bank decisions may change both price behavior and execution conditions. A stop order does not guarantee a fill at its trigger price.
Sessions matter too. London and New York trading hours often bring greater participation for major pairs, but more activity does not guarantee follow-through. Spreads may widen around news, daily rollover or periods of thin liquidity.
Check your broker's actual bid and ask prices rather than judging tradability from candle size alone. A visually tidy range is not necessarily an economical trade.
Choose between range trading, breakout trading and standing aside
Your response to a sideways market should follow a defined strategy, not frustration with waiting.
Range trading: fade the boundaries
A range trader looks for rejection near support or resistance and targets a move back into the range. This approach assumes the existing boundaries will continue to hold.
For a breakout-focused trader, switching to this method without testing it creates conflicting rules. You may end up buying resistance because you expect a breakout, then holding the losing position because you expect a rebound.
Breakout trading: wait for a change in behavior
During a sideways trend in forex, a breakout strategy waits for evidence that price can trade outside the established zone. It accepts missed entries in exchange for avoiding some premature signals.
The middle of the range is usually a poor location for this approach. Neither boundary has failed there, so the directional thesis remains unconfirmed.
Standing aside: reject an unsuitable setup
No trade is often the better decision when boundaries are unclear, costs are large relative to the range or important news is imminent. The same applies when a nearby higher-timeframe barrier leaves little potential reward.
Waiting is a valid strategy outcome. A chart pattern does not create an obligation to place an order.
How to distinguish a breakout from a temporary breach
Breakout confirmation should be specified before price reaches the boundary. Otherwise, it is easy to reinterpret each candle to justify an entry.
One approach requires a completed candle to close beyond the outer edge of the zone, rather than merely wick through it. Another requires an additional distance buffer, calibrated to recent volatility and execution costs. Neither method eliminates false signals.
A retest offers a different entry structure: price breaks out, returns toward the former boundary and then holds outside the range. This can make the invalidation point clearer, but some genuine breakouts never retest. Missing those moves is part of choosing that rule.
For any sideways trend in forex, confirmation involves a trade-off. Earlier entries offer more potential distance but less evidence. Later entries provide more evidence but may require a wider stop or leave less room before the next barrier.
Be cautious with volume confirmation. Spot forex is decentralized, so a retail platform's tick volume or broker-specific volume is not a consolidated measure of the entire market.
What makes a breakout fail?
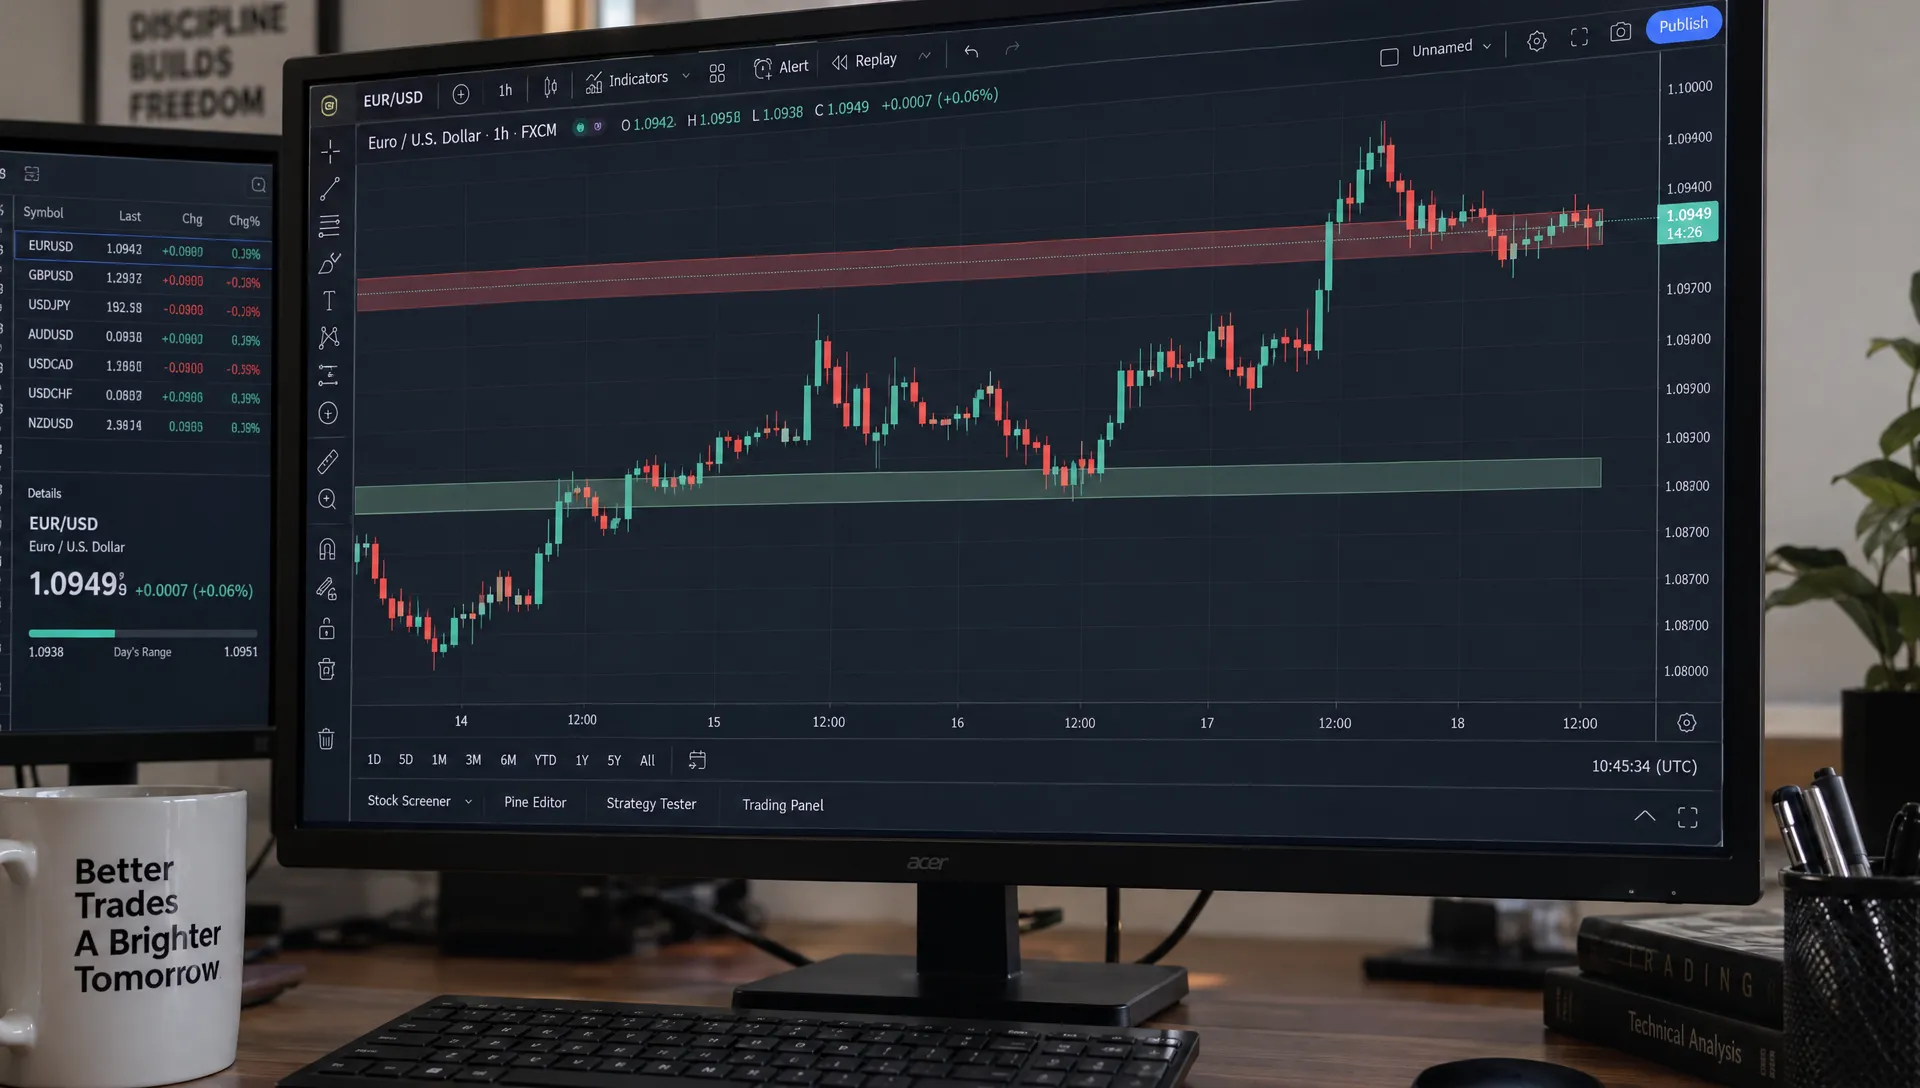
A false breakout occurs when price moves beyond the range but cannot sustain the move and returns inside it. That does not, by itself, prove manipulation or deliberate stop hunting.
Define failure in terms your strategy can execute. You might exit after a close back inside the range, use a protective stop at a predetermined price or apply a time-based exit when follow-through does not develop.
Each choice has costs. A tight exit may reject trades that later recover. A wider exit may survive more noise but increases the loss per unit of position size. Test those choices rather than assuming one is always superior.
Size the position around failure, not conviction
A sideways trend in forex can persist much longer than expected. Repeated breakout attempts therefore need a risk budget, not just an individual stop.
Consider this hypothetical EUR/USD setup:
| Item | Illustrative value |
|---|---|
| Established range | 1.0800 to 1.0840 |
| Planned long entry reference | 1.0845 |
| Protective stop reference | 1.0830 |
| Target reference | 1.0875 |
| Price distance to stop | 15 pips |
| Price distance to target | 30 pips |
These reference levels produce a nominal 2:1 reward-to-risk ratio before execution costs. They do not establish that the trade has a positive expected return. The stop must correspond to an invalidated setup, and the target needs sufficient room before opposing resistance.
Suppose a trader with a $10,000 account chooses a hypothetical $50 risk budget. For EUR/USD in a USD account, a standard 100,000-unit lot has a pip value of approximately $10. A 15-pip loss would imply roughly 0.33 standard lots before costs.
If the trader budgets an additional two pips for execution friction, the calculation becomes $50 ÷ (17 × $10), or approximately 0.29 lots. Actual sizing must reflect the broker's contract specifications, executable prices and commissions without double-counting spread.
Leverage magnifies losses as well as gains, as the CFTC's forex risk advisory explains. Stops cannot remove gap or slippage risk.
Limit repeated attempts and correlated exposure
One failed breakout should not automatically trigger another entry. Set an advance limit on attempts or total losses for the setup, and require fresh evidence before trying again.
Also consider shared currency exposure. Long EUR/USD and long GBP/USD both contain short-dollar exposure. Their combined risk may be greater than treating them as unrelated trades suggests.
Avoid widening the stop merely to keep a position open. If the original invalidation condition has occurred, a larger stop changes the trade rather than repairing it.
Test the rules before automating them
For a sideways trend forex traders intend to trade systematically, the range must be identifiable using only information available at the time. A backtest that draws boundaries from future highs and lows contains look-ahead bias.
Record the pair, session, timeframe, range definition, entry trigger and exit rule. Include variable spreads and plausible slippage, then evaluate results on data not used to tune the settings. Measure cumulative losses from repeated attempts, not just the best breakout.
If implementation exceeds your technical skills, providers of custom software and AI services can help build a scanner or testing workflow. Development support is separate from evidence that a trading strategy works; the rules and results still need independent validation.
Automation is most useful when it applies clear rules consistently. It cannot make an ambiguous range definition objective after the fact.
Frequently asked questions
How can you identify a sideways forex market? Look for repeated reactions around broadly horizontal support and resistance zones, overlapping swings and no sustained sequence of directional highs and lows. ATR, Bollinger Band width and ADX can provide supporting context.
Does low volatility guarantee a large breakout? No. A sideways trend in forex can continue, widen gradually or produce several failed breaks. Volatility contraction describes recent behavior, not a guaranteed future move.
Should breakout traders wait for a retest? A retest can clarify entry and invalidation levels, but it is not mandatory. Some breakouts continue without returning to the boundary. Choose a consistent, tested rule rather than switching based on fear of missing out.
Where should a stop go after a breakout? Place it where the setup would be invalidated, allowing for normal movement and execution conditions. Then adjust position size to fit the risk budget. Avoid choosing an arbitrary tight stop solely to make the potential reward ratio look attractive.
Is a range's width a reliable breakout target? Projecting the range's height beyond the boundary is a planning convention, not a reliable forecast. Nearby support or resistance, volatility and costs may make a closer target more realistic or eliminate the trade entirely.
Keep trading decisions separate from portfolio insight
A defined range, an executable confirmation rule and a realistic loss budget matter more than predicting which way a quiet currency pair will break.
If currency trading is only one part of your investing activity, Upside Invest can help you compare broader portfolio allocations and learn from verified, anonymous investor holdings. Keep that portfolio context separate from the price-based rules used to enter and exit a forex trade.