What Is a Good Sharpe Ratio for a Personal Portfolio?

A good Sharpe ratio for a personal portfolio is often around 0.5 to 1.0, while 1.0 or higher generally indicates strong historical risk-adjusted performance. A ratio above 2.0 is unusually strong and deserves a closer look at the calculation, time period and underlying investments.
Those are guidelines, not universal targets. A retirement portfolio holding substantial cash should not be judged against an aggressive stock portfolio without considering their different purposes. The useful question is whether your portfolio has earned enough return above cash to justify its volatility, measured consistently over a meaningful period.
What is a good Sharpe ratio for a personal portfolio?
Use these rough interpretation bands for annualized historical Sharpe ratios:
| Annualized Sharpe ratio | Practical interpretation |
|---|---|
| Below 0 | The portfolio underperformed the risk-free return over the measured period |
| 0 to below 0.5 | Modest compensation for the volatility taken |
| 0.5 to below 1.0 | A reasonable result for many diversified personal portfolios |
| 1.0 to below 2.0 | Strong risk-adjusted performance |
| 2.0 to below 3.0 | Unusually strong performance that warrants checking the assumptions |
| 3.0 or higher | Exceptional historical results requiring particularly careful scrutiny |
These bands are interpretation aids, not evidence that most investors achieve them. Results vary with market conditions, asset allocation and the measurement window.
A portfolio with a ratio of 0.7 can still be appropriate for its owner. Conversely, a ratio of 1.8 does not establish that a strategy is safe, repeatable or suitable for someone approaching retirement.
What the Sharpe ratio actually measures
The Sharpe ratio measures average return above a risk-free benchmark per unit of return volatility. It answers a narrower question than whether an investment is good overall.
For monthly observations, the calculation is:
Monthly Sharpe ratio = Average monthly excess return ÷ Standard deviation of monthly excess returns
Here, each month's excess return is the portfolio return minus the risk-free return for that same month. Under the usual square-root-of-time convention:
Annualized Sharpe ratio = Monthly Sharpe ratio × √12
William F. Sharpe’s explanation of the ratio describes this differential-return approach and its limitations.
A good Sharpe ratio therefore reflects the relationship between excess return and variability, not simply a high account balance or a profitable year. The ratio is unitless: a result of 0.8 is not an 80% return.
Why CAGR is not the right numerator
The standard historical calculation uses the arithmetic average of periodic excess returns, not compound annual growth rate, or CAGR.
CAGR describes the compounded growth of an investment over time. That makes it useful for understanding wealth accumulation, but substituting it into the Sharpe formula changes the calculation and can make comparisons misleading.
When comparing figures from different platforms, check whether they use the same return frequency, risk-free benchmark and annualization method. Two numbers carrying the same label may have been calculated differently.
Example: the higher-return portfolio does not always win
Consider three hypothetical portfolios measured over the same period. For simplicity, assume each uses a constant annualized risk-free rate of 4%, and all figures follow consistent annualization conventions.
| Portfolio | Annualized arithmetic mean return | Annualized excess-return volatility | Sharpe ratio |
|---|---|---|---|
| A | 10% | 12% | 0.50 |
| B | 8% | 5% | 0.80 |
| C | 14% | 20% | 0.50 |
Portfolio A's calculation is (10% − 4%) ÷ 12% = 0.50.
Portfolio B earns less but delivers more excess return for each unit of volatility. Portfolio C has the highest return, yet its Sharpe ratio is no better than A's because its volatility is also much higher.
None is automatically the right choice. Portfolio B might not generate enough growth for a particular goal, while C might expose its owner to losses they cannot afford. A good Sharpe ratio is one input to that decision, not the decision itself.
How to calculate a ratio you can trust
Use portfolio returns, not changes in account value
Deposits and withdrawals can distort apparent performance. If you add $10,000 to a $50,000 account, the higher balance is not an investment gain.
For portfolio comparison, use a return series that adjusts for external cash flows. Time-weighted returns are generally more suitable for comparing investment performance without letting contribution timing dominate the result.
Include dividends, interest and the cash held inside the portfolio. Calculate returns net of relevant investment costs where possible, and check whether reported figures are before or after taxes. An equity-only calculation can tell a different story from one covering the entire account.
Money-weighted returns can help describe your personal investing experience, but they are not interchangeable with a time-weighted periodic series.
Match the risk-free rate and observation frequency
For a US-dollar portfolio, short-term US Treasury bills are a common risk-free proxy. Use a rate appropriate to the currency and measurement period rather than automatically assuming cash earns zero.
Monthly portfolio returns require monthly risk-free returns. Do not subtract an annual Treasury yield directly from a monthly portfolio return. For a multiyear calculation, use a historical risk-free series rather than applying today's yield to every past month.
Annualizing daily observations usually involves multiplying the daily ratio by the square root of approximately 252 trading days. Monthly observations use the square root of 12. Neither convention guarantees accuracy when returns are serially correlated, meaning one period's return is related to another's.
A good Sharpe ratio is only useful if its inputs and annualization method are consistent.
Examine enough history to include different conditions
A 12-month figure can describe recent conditions, but it provides limited evidence about durability. A strong rally or a quiet market can make a strategy look more efficient than it will prove over a full cycle.
Where data allows, examine three- and five-year periods alongside shorter rolling windows. These are practical review periods, not statistical guarantees. Even five years can miss a strategy's most damaging environment.
For a strategy with little history, treat the result as preliminary. Avoid ranking a six-month account against a five-year account as though the evidence were equally informative.
Why a high Sharpe ratio can mislead
The denominator measures volatility, not every kind of risk. In particular, check for:
- Hidden tail risk: Strategies that earn small, steady gains while accepting occasional severe losses can look attractive before a large loss occurs.
- Smoothed valuations: Infrequently valued or illiquid assets may show artificially low measured volatility, inflating the ratio.
- Selection bias: Rankings containing only surviving accounts or visible winners can overstate what a typical investor experienced.
- Backtest overfitting: A strategy selected after testing many variations may have an impressive historical score that does not persist.
- Favorable market exposure: A portfolio may benefit from a particular market regime without having a durable advantage.
Leverage needs separate attention. In an idealized model, scaling an exposure through borrowing at the risk-free rate can leave its Sharpe ratio unchanged while magnifying gains and losses. Real borrowing costs, margin calls and forced selling create additional problems.
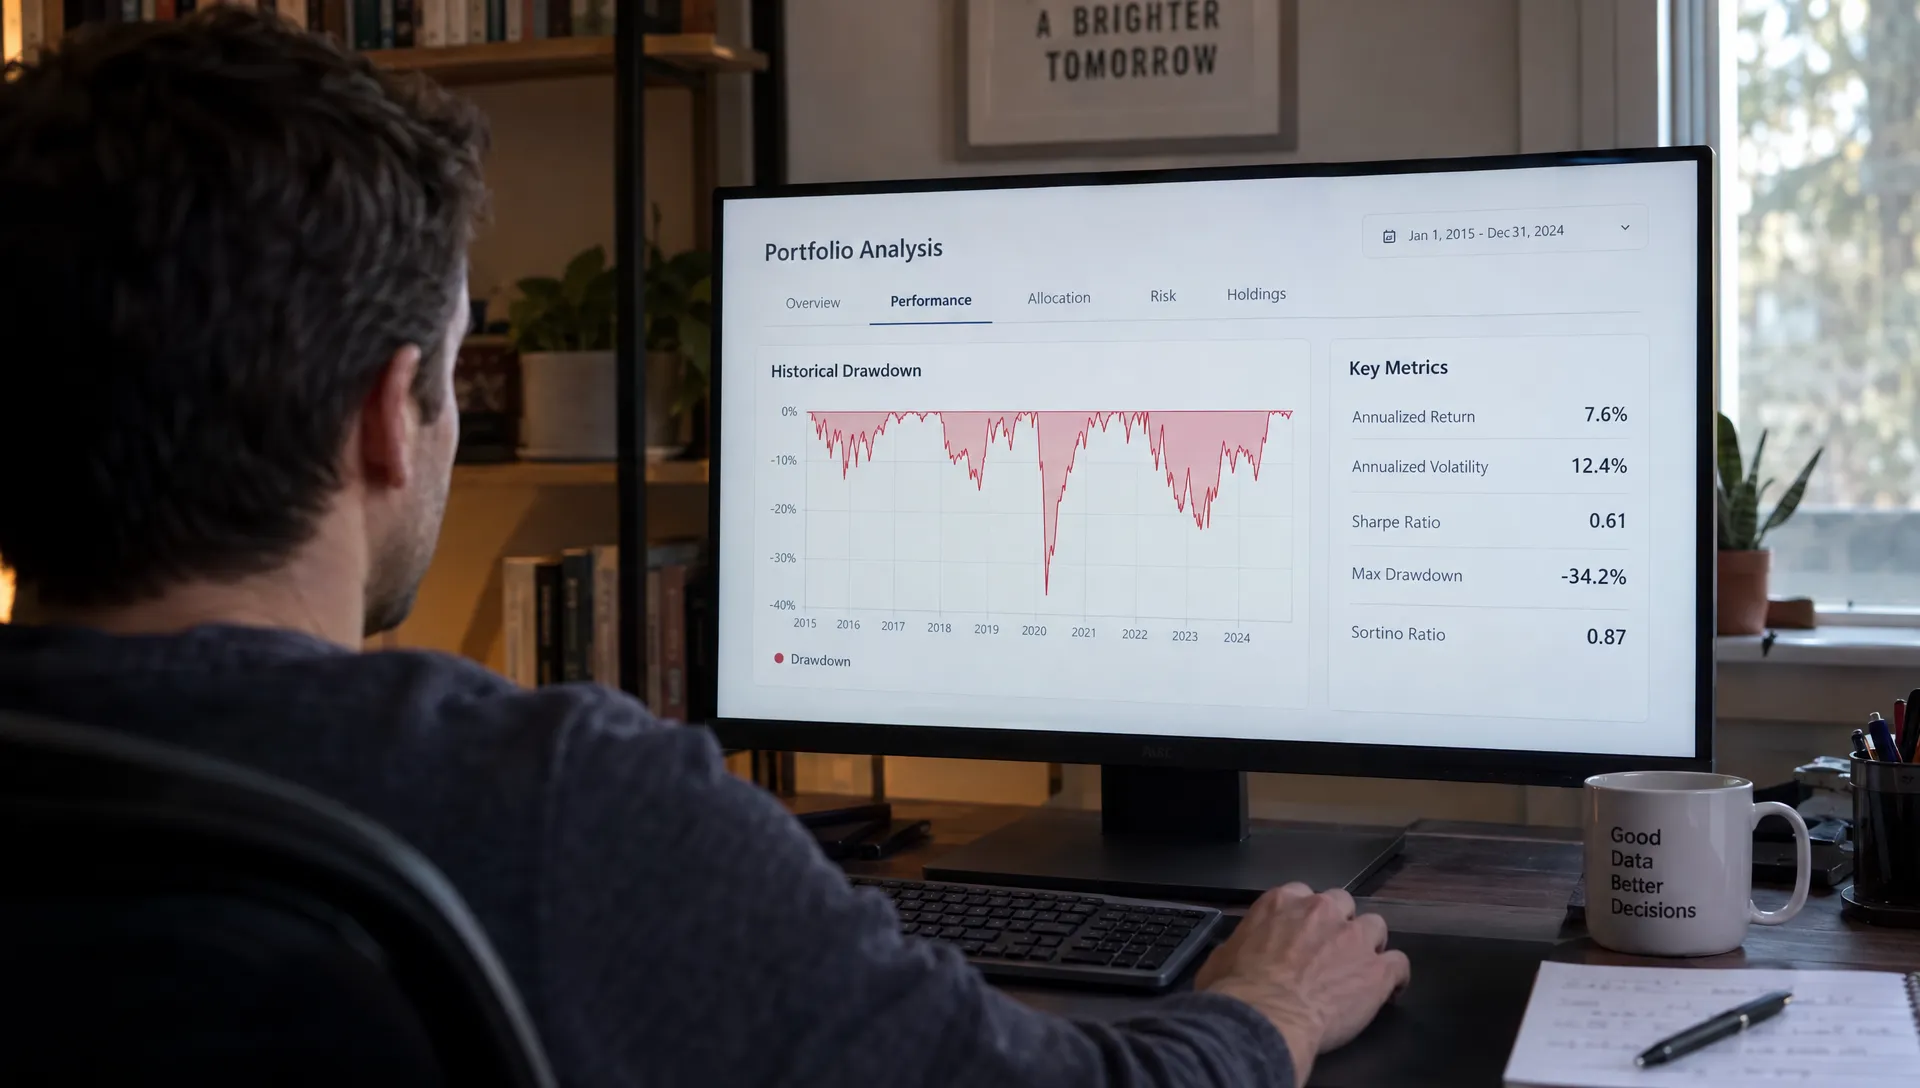
A good Sharpe ratio also does not tell you the maximum loss you might experience. Read it alongside maximum drawdown, liquidity and concentration. The Sortino ratio can add another perspective because it focuses on downside deviation relative to a chosen target rather than treating all volatility alike.
Make portfolio comparisons genuinely comparable
Before comparing your score with another investor's, establish that both calculations cover the same dates and use compatible methods. Then compare the underlying allocations.
An investor holding mostly short-term bonds has a different return objective from someone holding concentrated technology stocks or crypto. Comparing their ratios can be informative, but treating the higher figure as an automatic recommendation ignores those differences.
Verified investor holdings add useful context about what someone owns. They do not, by themselves, establish that the investor's strategy is appropriate for you or that past results will continue. Anonymous profiles can protect privacy while still leaving questions about liabilities, other accounts or future spending needs unanswered.
Use peer data to investigate allocation choices and concentration, not simply to copy the account at the top of a ranking. For evaluating investment skill, performance relative to an appropriate benchmark may also matter; the Sharpe ratio measures return above a risk-free rate, not outperformance against a stock or balanced-portfolio benchmark.
Improve the portfolio, not just the score
Start with changes that have a clear economic purpose: reduce unnecessary fees, address excessive concentration and choose an asset allocation consistent with your horizon and loss tolerance.
Diversification can improve risk-adjusted performance when assets do not move together, but the benefit depends on their correlations and returns. Adding more holdings does not guarantee a better result, particularly if they contain similar exposures.
Avoid repeatedly changing allocations to maximize the ratio over the latest few months. That can encourage performance chasing and trading costs. Review whether the portfolio still serves its purpose before responding to a small change in its score.
A good Sharpe ratio cannot compensate for insufficient savings, a near-term cash shortage or an allocation you will abandon during a downturn.
Keep emotional strain separate from portfolio optimization
A portfolio's practical suitability includes whether you can tolerate its fluctuations without making impulsive decisions. A planned review schedule and adequate cash for near-term needs may help reduce the pressure to react to every market move.
Persistent stress affecting sleep or daily functioning deserves attention independently of investment performance. A qualified mental health professional can help assess your needs; services such as Montgó Lifestyle’s private support for stress and burnout focus on personal recovery rather than portfolio metrics.
Frequently asked questions
Is a Sharpe ratio of 1 good? Yes. An annualized historical ratio of 1 generally indicates strong risk-adjusted performance. Its usefulness still depends on the observation period, calculation method and risks that volatility may miss.
Is a negative Sharpe ratio always a reason to sell? No. It means the portfolio underperformed the selected risk-free benchmark during the measured period. Investigate the cause, your investment horizon and whether the allocation remains appropriate before changing it.
Can a portfolio have a high Sharpe ratio and still lose money? Yes. A high historical ratio does not prevent future losses. Even during the measurement period, a portfolio can experience substantial drawdowns despite a favorable overall score.
How often should I check my portfolio's Sharpe ratio? Quarterly or semiannual reviews are a reasonable starting point for many long-term investors. Use consistent trailing periods and avoid treating small changes as trading signals.
Put risk-adjusted performance in context
Use Upside’s portfolio comparison tools to explore verified investor holdings, compare allocations and review return and Sharpe metrics through anonymous profiles. Pair those insights with your own time horizon, liquidity needs and tolerance for losses.
The most useful score is not necessarily the highest one. It is a consistently calculated measure that helps you understand whether your portfolio's returns justify the risks you are taking.