How to Backtest a Trend Algo Without Look-Ahead Bias
A trend algo can produce an impressive backtest by making one impossible assumption: trading on information that was not available yet. A signal calculated from today’s closing price cannot normally buy at that same closing price. A weekly indicator cannot use Friday’s final reading to justify Monday’s entry.
The practical fix is to treat backtesting as a timestamp audit, not just a return calculation. Define when every input becomes available, when the strategy makes its decision and when an order could realistically fill. Then test the frozen rules on data you did not use to design them.
What look-ahead bias actually means
Look-ahead bias occurs when a historical decision uses information that became available after that decision. It can enter through indicators, execution assumptions, dataset construction or portfolio selection.
Common examples include using a completed daily high before the session ends, applying a revised economic release to its original publication date or testing only stocks that belong to an index today.
There are also subtler forms. A swing-high indicator might identify a turning point only after several later bars confirm it, then draw its marker back on the original bar. Trading from that marker’s displayed date gives the strategy knowledge it never had.
A useful test is: Could you have generated this exact order, with these exact inputs, at that historical moment? If the answer requires a later price, a future constituent list or a revised dataset, the result is not causally valid.
Turn a trend algo into a complete strategy
An indicator that colors a chart green or red is not yet a trading system. Before testing, write a specification that another person could implement without interpreting the chart.
Here is an illustrative daily strategy, not an investment recommendation:
| Component | Fixed rule |
|---|---|
| Instrument | One instrument selected before examining test results |
| Trend signal | Closing price above its trailing 200-session simple moving average |
| Entry | If flat and the condition is true, buy at the next session’s open |
| Exit | If invested and the close is at or below the average, sell at the next session’s open |
| Position size | Invest available cash without leverage, allowing for execution costs |
| Warm-up | Wait for 200 completed sessions before generating a signal |
| Missing data | Do not invent prices or assume an unavailable opening fill |
Specify whether fractional shares are allowed, how cash earns interest and how corporate actions affect holdings. Repeated bullish signals should not create additional purchases if the strategy is already fully invested.
Keep this specification with the results. Changing an exit rule after seeing a drawdown creates a new strategy version and requires fresh validation.
For the broader investment-process context, Upside’s guide to systematic trend following from signals to execution connects signal design with sizing and implementation. Here, the focus is whether the historical simulation obeys those rules honestly.
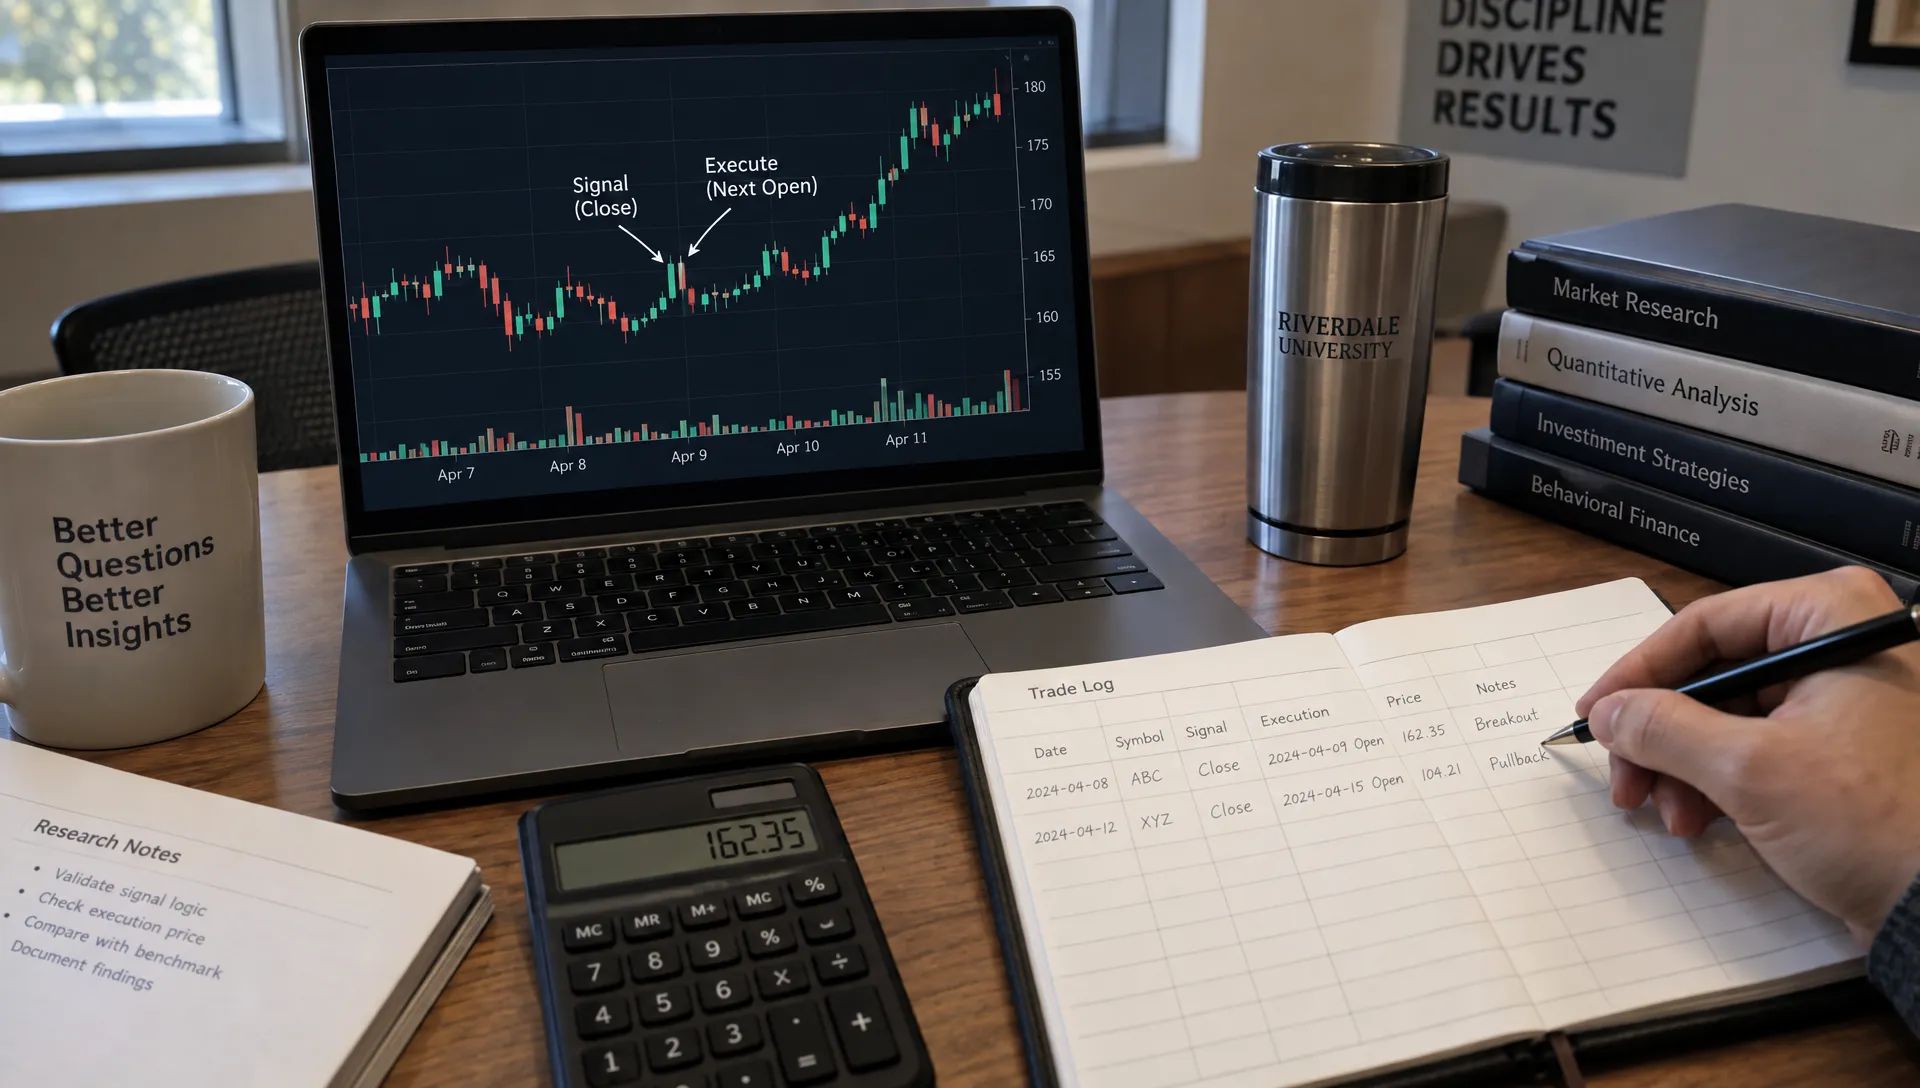
Separate signal time from execution time
For a daily trend algo, the simplest defensible convention is to calculate signals after the completed session and execute at the following session’s open. The overnight gap belongs in the result.
Consider this hypothetical sequence:
| Event | Information available | Permitted action |
|---|---|---|
| Monday close | Close is $100 and the moving average is $99 | Generate a buy instruction |
| Tuesday open | Opening price is $102 | Execute the purchase, subject to costs |
| Thursday close | Close is $97 and the moving average is $98 | Generate a sell instruction |
| Friday open | Opening price is $95 | Execute the sale, subject to costs |
The gross trade return is 95 / 102 - 1, approximately -6.86%. Buying at Monday’s $100 close would incorrectly improve the result under this execution convention.
A market-on-close implementation needs a different specification. Its inputs must be available before the applicable order deadline. You cannot assume access to the final official close and simultaneously assume an order was submitted in time to receive it.
Check repainting and higher-timeframe inputs
A completed-bar signal can still contain future information. Weekly values mapped onto daily bars must respect when the weekly bar actually finishes. Until then, either use the last completed weekly value or explicitly simulate the developing value from information available at that moment.
TradingView’s repainting documentation explains why historical and real-time calculations can differ. For platform testing, also inspect the strategy execution settings, including order timing and broker-emulator assumptions. A plausible chart does not establish plausible execution.
Build a point-in-time dataset
A trend algo needs data that represent what the strategy could have known, not simply the cleanest history available today. Record the source, download date, timezone, session calendar and adjustment conventions.
For multi-asset research, reconstruct the eligible universe at each date. Include delisted securities where relevant. Testing today’s surviving funds or highest-performing stocks can introduce survivorship and selection bias even when every moving-average calculation is correct.
Fundamentals and alternative data need an availability timestamp as well as an observation date. A quarter-end balance-sheet number was not necessarily published at quarter-end. Likewise, a portfolio holding dated September 30 may not have been disclosed until later.
Corporate actions require consistent accounting. Handle splits without creating artificial gains or false trend breaks. Account for dividends in portfolio returns and distinguish dividend receivables from cash available to trade.
Fully back-adjusted prices are not automatically invalid for scale-invariant signals, such as price relative to a moving average. However, adjustments can distort historical dollar thresholds, share sizing or cash flows when used inconsistently. Document which series drives signals and which prices determine fills.
Freeze the dataset used for each experiment. If a vendor later corrects a bar, retain both the original research snapshot and the corrected version so you can explain any result changes.
Run the simulation in chronological order
Implement the trend algo as a sequence of events rather than a collection of chart annotations. At every step, the simulation should have access only to its current state and previously available observations.
A reference event loop looks like this:
For each trading session in chronological order:
    Apply effective corporate actions consistently.
    At the open, process orders queued after the previous close.
    Apply execution prices, trading costs and cash constraints.
    During the session, process only explicitly modeled events.
    At the close, mark holdings and record portfolio equity.
    Add the completed bar to indicator history.
    If warm-up is complete, calculate the desired position.
    Queue any required change for the next eligible open.
This is pseudocode, not a complete trading engine. Your implementation must also handle rejected orders, unavailable opening prices and the end of the dataset.
Keep an audit log containing the signal timestamp, latest input timestamp, intended order, execution timestamp, fill price, costs and resulting position. That log makes suspicious trades traceable.
If you use vectorized calculations, inspect the alignment explicitly. A signal based on session t cannot earn the overnight return ending at the open of t+1 before the position exists. Adding a one-row shift is not enough unless the return interval matches the execution convention.
Charge costs where trades actually occur
A trend algo should pay costs when its position changes, not through an arbitrary annual deduction. Include commissions, bid-ask spread and slippage using assumptions appropriate to the instrument and order size.
For the hypothetical $102 entry and $95 exit, assume a combined execution-cost allowance of 0.10% on each side. Ignoring share rounding, the net return is:
95 × (1 - 0.001) / [102 × (1 + 0.001)] - 1
That is approximately -7.05%, rather than the gross loss of 6.86%. These costs are illustrative assumptions, not estimates for a particular broker or market.
Avoid double-counting spread if your fill-price model already includes it. For short strategies, add borrow availability and financing assumptions. For futures, define contract rolls and margin treatment. Crypto tests need venue-specific fees, trading calendars and, where applicable, funding payments.
Run a base-cost scenario and a harsher scenario. A strategy that works only with near-zero friction is vulnerable to implementation differences.
If you later introduce intraday stops, daily OHLC bars may not reveal whether a stop or another order triggered first. Use finer data or a documented conservative convention rather than choosing the more profitable path.
Reserve untouched data before tuning
Chronological separation is essential. Randomly shuffling market observations mixes regimes and can put future conditions into the development process.
Use development, validation and final test periods
Use the development period to build the rules. Use validation data to compare a limited set of choices, such as nearby lookback lengths. Keep a final period untouched until the design and evaluation criteria are frozen.
The final test is not still untouched after you examine its results and revise the strategy. At that point, it becomes part of development history. Record the revision and seek genuinely new evidence.
Historical data before the test boundary can provide indicator warm-up because those observations would have been known. That does not justify fitting parameters on future test observations.
Choose period lengths based on the strategy’s trading frequency and available history. A slow system may generate too few trades in a short holdout to support a useful conclusion.
Add walk-forward evaluation
A walk-forward test repeatedly selects parameters using an earlier window and applies them to a later window. Stitch together only those later, out-of-sample segments for the evaluation curve.
For a trend algo that recalibrates monthly, simulate that actual monthly schedule. Do not let each window select parameters using the period it is supposed to predict.
Where outcome labels or holding periods overlap across boundaries, remove overlapping training examples as needed. More elaborate validation machinery does not compensate for incorrect timestamps or a repeatedly reused final test set.
Use adversarial checks to expose hidden leakage
A smooth equity curve is weak evidence of correctness. Deliberately challenge the implementation before interpreting its profitability.
The most useful checks include:
- Prefix replay: Run through a chosen date, then rerun with later data appended. Earlier signals and decisions should remain unchanged when the historical inputs are unchanged.
- Future-data mutation: Replace prices after a cutoff with extreme values. Decisions before that cutoff must not change.
- Input-timestamp assertions: Reject any decision that references an observation available after the decision time.
- Hand reconciliation: Calculate several entries, exits and cash balances manually, including gaps and fees.
- Execution-delay sensitivity: Add another bar of delay and measure how dependent the result is on precise timing.
Prefix replay is particularly useful for indicators that place historical markers retrospectively. Preserve the signals generated at each replay step rather than trusting the indicator’s final chart.
A trend algo that passes these checks is not necessarily profitable, but it has cleared an important implementation hurdle. If earlier decisions change when only future prices change, stop evaluating returns and investigate the calculation.
Delay sensitivity is different: weaker results after a delay do not prove leakage. They show execution dependence. Similarly, repainting tests do not detect survivorship bias, so keep the dataset audit separate.
Evaluate returns alongside risk and robustness
Once causal integrity is established, compare net results against a relevant benchmark over identical dates. For the illustrative long-or-cash strategy, buy-and-hold in the same instrument is a useful starting point, with consistent dividend and cost treatment.
Report more than total return:
| Measure | What it helps reveal |
|---|---|
| Annualized return | Growth over the evaluation period |
| Maximum drawdown | Largest peak-to-trough equity decline |
| Sharpe ratio | Return relative to variability, using a documented risk-free convention |
| Market exposure | How much time and capital were invested |
| Turnover and total costs | Dependence on frequent trading and execution assumptions |
| Trade count and concentration | Whether a few trades dominate the outcome |
Calculate portfolio metrics from the full equity series, including cash periods, rather than only profitable trades or invested days. State the observation frequency and annualization method. Serial correlation can make simple Sharpe annualization misleading.
A trend algo should also face sideways, rising and falling markets. Report regime results using definitions fixed in advance, not labels chosen to flatter the strategy.
Check nearby parameter settings without selecting whichever looks best afterward. Similar behavior across a reasonable neighborhood is more reassuring than a single isolated optimum, though it does not guarantee persistence. Record unsuccessful configurations too, because testing many alternatives increases the chance of finding an attractive result by accident.
Frequently asked questions
Is trading at the same bar’s close always look-ahead bias? No. It depends on whether the required inputs were available before the order deadline and whether the assumed fill was attainable. A signal requiring the final close generally cannot also assume execution at that close without a justified mechanism.
Does waiting for bar close eliminate repainting? No. It prevents decisions based on that bar’s unfinished values, but an indicator may still use future confirmation bars, incomplete higher-timeframe values or retrospective plotting. Test how signals behave during chronological replay.
How much historical data is enough? There is no universal minimum. A trend algo needs enough independent trading opportunities and varied conditions to make its results informative. Ten years with very few trades can still leave substantial uncertainty.
What should happen after a backtest passes? Freeze the code and run a forward paper test using live information arrival and realistic order handling. Reconcile each signal and fill against the simulator before considering capital allocation. A passing backtest does not establish future profitability.
Use portfolio intelligence to generate hypotheses, not rewrite history
Upside Invest lets you compare verified investor holdings and portfolio allocations through private, anonymous profiles. That context can help you identify investment ideas worth investigating.
Keep discovery separate from validation. Today’s winning portfolios cannot stand in for a historical investable universe, and current holdings cannot explain decisions made before those holdings were available. Treat portfolio observations as new hypotheses, then test them with timestamped inputs, realistic execution and genuinely out-of-sample evidence.