Systematic Trend Following From Signals to Execution
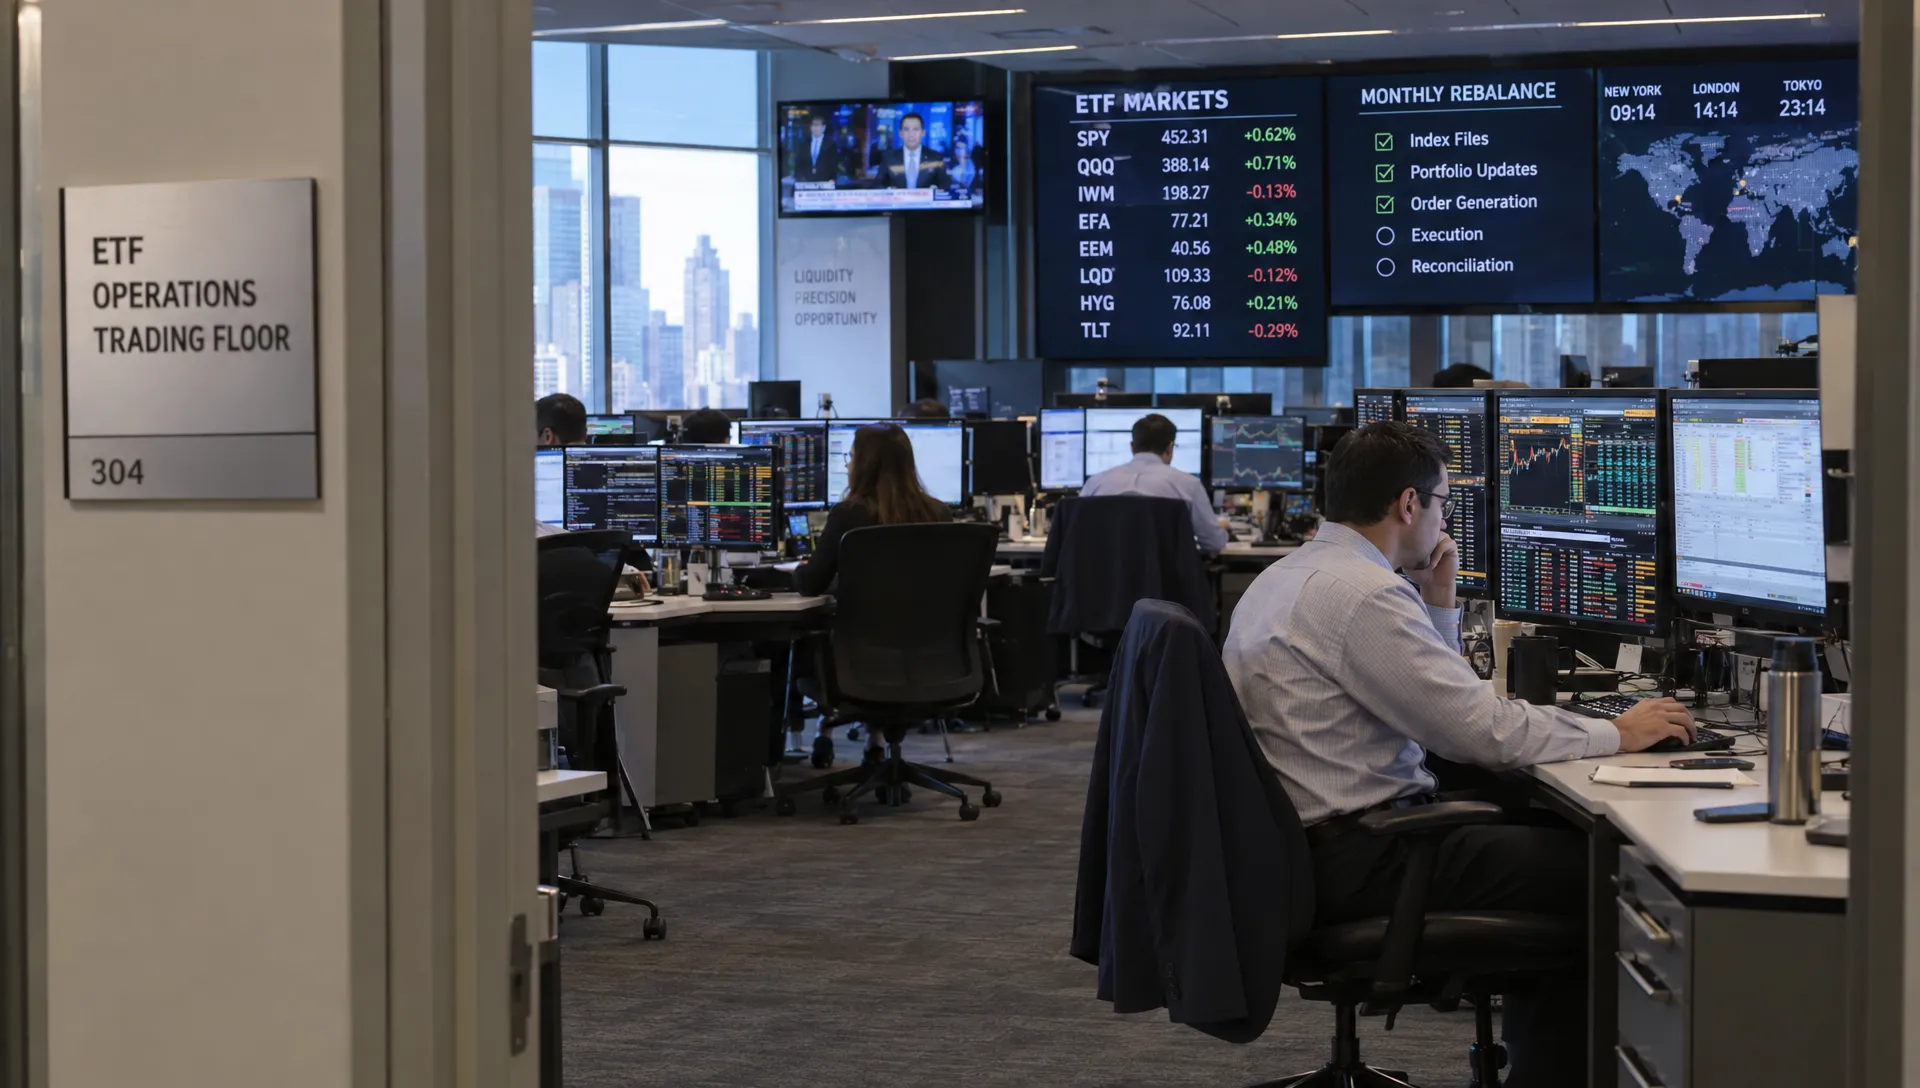
Systematic trend following turns a market observation into a repeatable investment process: measure price direction, translate that signal into an allocation and execute according to predefined rules. The objective is not to predict the next market turning point. It is to participate in persistent moves while controlling exposure when conditions change.
A signal alone does not accomplish that. A moving average can tell you whether an asset is trending, but it cannot resolve a missing price, calculate an affordable order or decide what happens after a partial fill. Those details determine whether a strategy can survive contact with a brokerage account.
The useful starting point is therefore an executable specification, not a search for the best indicator. Every decision should have a defined input, calculation time and permitted action. Someone else should be able to follow the instructions without asking what you meant.
This guide follows that process using an illustrative, unleveraged ETF portfolio. The examples explain implementation rather than recommend particular securities or parameters. Futures, short selling and crypto require additional controls that this simpler setup does not cover.
Write a systematic trend following specification
Start by defining the investment universe, signal clock and trading clock. “Buy assets in an uptrend” leaves all three unresolved.
For example, a monthly process could evaluate a fixed list of liquid ETFs after the final trading session of each month. It would generate orders for a predefined window in the following session, not assume execution at the closing price that produced the signal.
A basic specification might look like this:
| Component | Illustrative rule | Implementation detail |
|---|---|---|
| Universe | A predefined list of liquid ETFs | Record additions and removals with effective dates |
| Trend signal | Month-end adjusted close above its 200-day moving average | Use a consistent adjustment methodology |
| Direction | Long or cash | No short exposure or borrowing |
| Sizing | Volatility-aware weights subject to caps | State the lookback and calculation method |
| Rebalance | Monthly | Define the next-session execution window |
| Exit | Signal becomes negative | Use the same observation schedule as entries |
| Exceptions | Pause new orders when required data fails validation | Log the failure and follow a recovery procedure |
These are example choices, not universally optimal settings. Monthly evaluation reduces decision frequency but can respond slowly to reversals. A long-or-cash design also behaves differently from a diversified long-short futures strategy.
For additional detail on separating filters from triggers, Upside’s guide to stock trend-following entry rules covers that narrower decision. Here, the focus is making the entire process reproducible.
Build a point-in-time data pipeline
Reliable systematic trend following depends on information that was actually available when each decision occurred. A backtest becomes misleading if it quietly uses future knowledge.
Keep signal data separate from execution data. Split- and dividend-adjusted prices can help measure a consistent historical trend, while orders must use actual tradable quotes. Your accounting must also handle distributions consistently so that dividends are not counted twice.
For an ETF strategy, check timestamps, exchange calendars, missing observations and corporate actions before calculating signals. A zero price should fail validation, not become a dramatic sell signal. A stale observation should not silently pass as a fresh close.
Record the universe as it existed at each historical date. Testing only funds that remain available today can exclude closures and other unsuccessful products, creating survivorship bias.
A failed data check is an operational event, not an investment opinion. Specify whether the process temporarily retains existing positions, blocks new orders or requests review. Do not let a missing value automatically become a zero target weight unless that behavior is deliberately intended.
Finally, save a snapshot containing the input timestamp, data version, signal values and strategy version. When a trade looks wrong later, you need to reconstruct what the system knew, rather than inspect a revised dataset and guess.
Convert signals into portfolio-level target weights
A positive signal answers whether an asset qualifies for exposure. It does not answer how much to own. In systematic trend following, this distinction prevents a collection of individually reasonable trades from becoming an oversized portfolio bet.
One possible sizing approach scales exposure inversely with estimated volatility:
Uncapped weight = standalone volatility allocation ÷ estimated annualized asset volatility.
Suppose the illustrative allocation is 4% and an ETF’s estimated annualized volatility is 20%. The resulting uncapped weight is 20%. If the strategy limits any one holding to 10%, the target becomes 10%.
That 4% input is a sizing parameter, not a maximum loss estimate. Volatility estimates can change, correlations can rise and realized losses can exceed expectations.
Apply portfolio constraints after calculating preliminary weights. These might include a maximum invested percentage, position caps, sector limits and a prohibition on leverage. If preliminary targets exceed available capital, a predefined scaling rule must bring them back within budget.
Correlation matters too. Several equity ETFs can represent substantially overlapping exposure even when their names differ. Counting holdings does not establish diversification.
For a long-or-cash strategy, decide where unallocated capital sits and how its return and costs are modeled. Brokerage cash, money market funds and short-term Treasury funds are not interchangeable operationally or economically.
The output of this stage should be a target-weight file with a reason for each allocation. It should not yet be an order ticket.
Translate target weights into executable orders
The execution stage of systematic trend following reconciles desired exposure with what the account already owns. Skipping this reconciliation can create duplicate trades or spending beyond available cash.
Consider a hypothetical $100,000 account:
| Item | Illustrative value |
|---|---|
| Target ETF weight | 10% |
| Target holding value | $10,000 |
| Current holding | 150 shares |
| Reference price | $50 |
| Current holding value | $7,500 |
| Estimated purchase | 50 shares |
The calculation assumes the account value and reference price are sufficiently current. An actual fill at $50.10 would cost $2,505 before fees, so the completed position would differ slightly from the original target.
Define an acceptable drift threshold rather than trading every tiny mismatch. Small adjustments can consume spread and fees without meaningfully changing exposure. Also account for whole-share restrictions, pending orders and cash reserved for other purchases.
Choose order types deliberately. Market orders prioritize execution but do not guarantee price. Limit orders constrain price but may remain unfilled. The SEC’s explanation of order types is a useful reference for these trade-offs.
A complete order policy specifies the trading window, treatment of partial fills, cancellation deadline and response to rejected orders. Before retrying a submission after a connection failure, check whether the broker already accepted it.
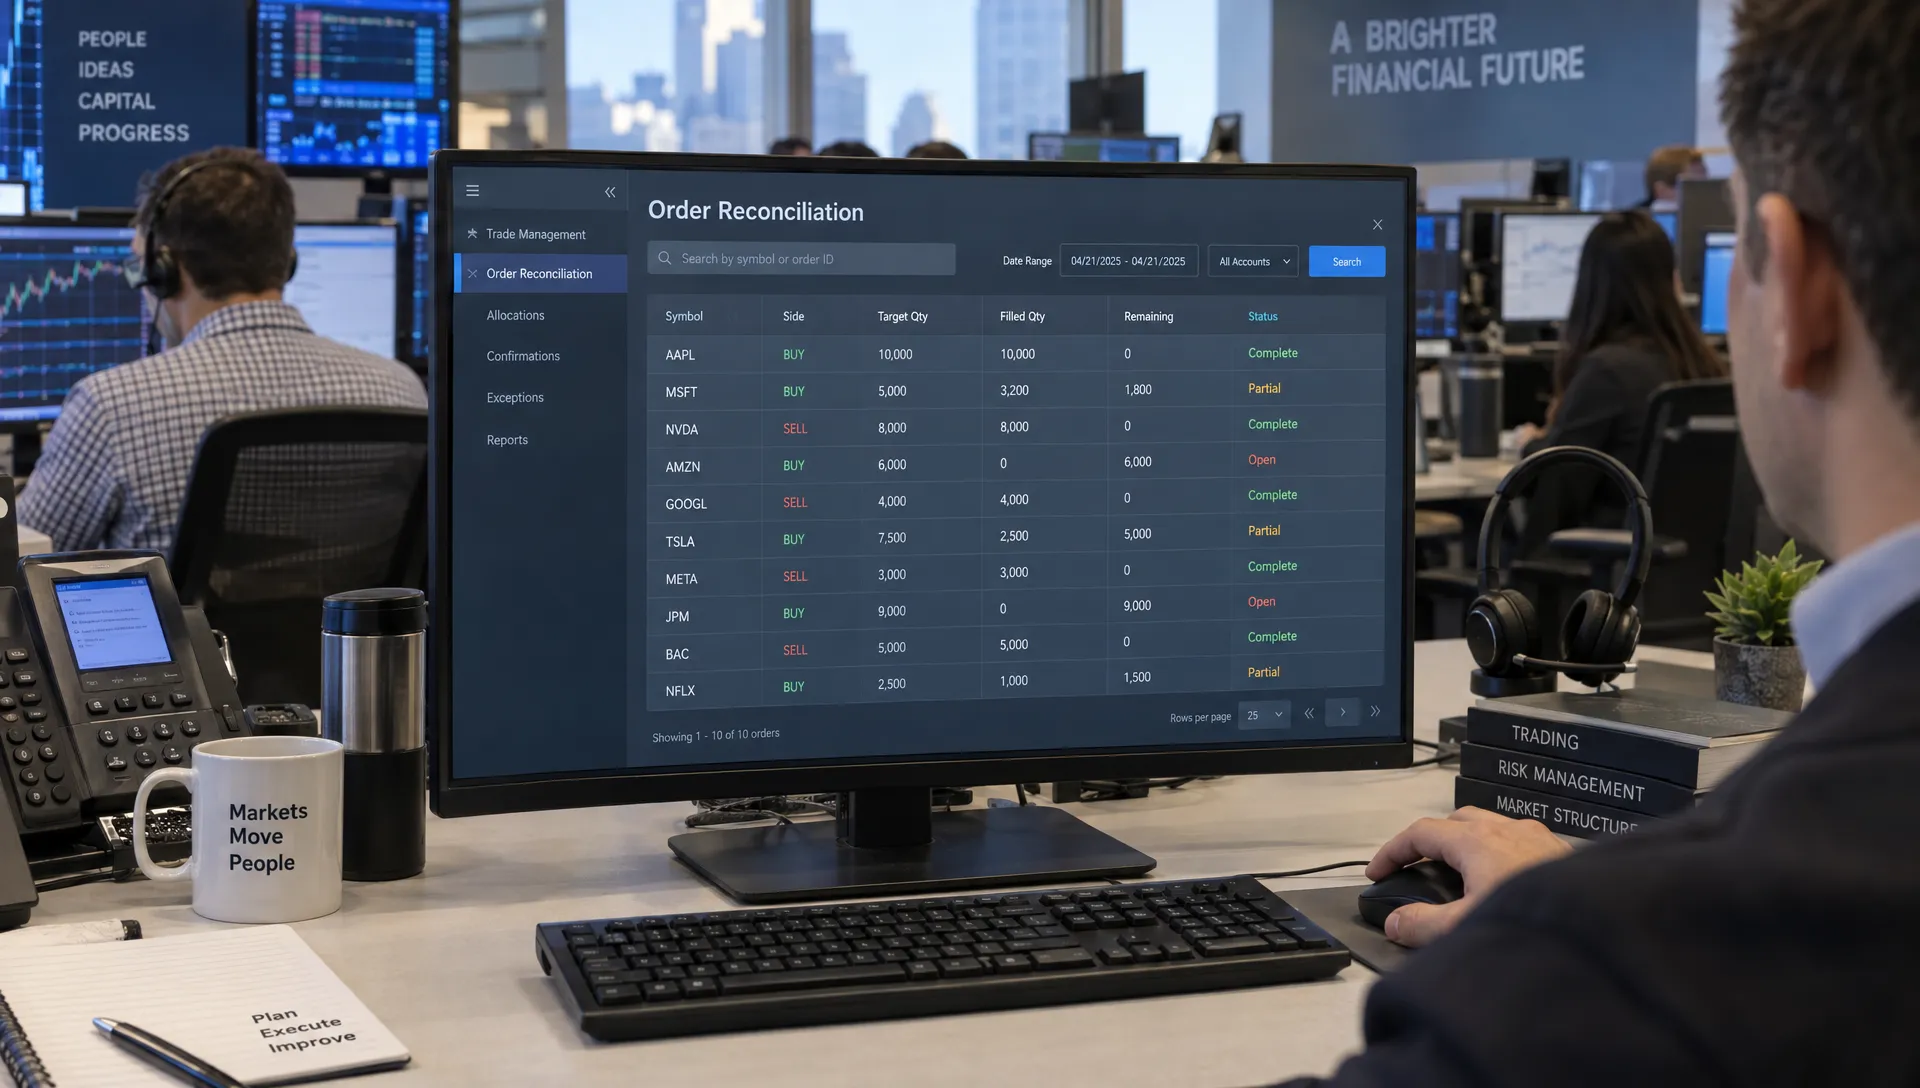
The signal log records intent; the broker’s execution record establishes what actually happened. Reconcile the two before considering the rebalance complete.
Test the full process, not just the indicator
A backtest of systematic trend following should reproduce the sequence you could have followed in practice: observe completed data, calculate targets, submit orders and account for execution afterward.
Using the same closing price both to create a signal and to fill the resulting trade generally introduces an unrealistic timing assumption. Next-session execution is one possible alternative, provided the simulated price and trading window match the intended process.
Include commissions where applicable, bid-ask spreads, slippage and fund expenses where they are not already reflected in the return series. Do not interpret zero commission as zero trading cost. Model cash returns consistently and examine tax consequences separately for the account type involved.
Measure more than annualized return. Maximum drawdown, turnover, time under water, exposure and results after costs help reveal whether the process is usable. A Sharpe ratio adds information about return relative to variability, but it does not describe every risk or guarantee comparability across different measurement methods.
Research such as AQR’s A Century of Evidence on Trend-Following Investing provides historical context. It does not validate your particular ETF universe, parameters or execution assumptions.
Check robustness before choosing parameters
The strongest-looking historical setting is not necessarily the most reliable. Evaluate neighboring lookbacks and trading schedules rather than selecting the single best result from a large search.
A credible systematic trend following test should also separate development data from later evaluation data. Once you inspect the evaluation period and revise the model around its weaknesses, that period is no longer an untouched test.
Useful checks include:
- Parameter stability: Does performance depend on one unusually precise lookback?
- Cost sensitivity: Does the strategy remain plausible under less favorable spreads and fills?
- Regime sensitivity: How does it behave during sideways markets, sharp reversals and prolonged trends?
- Operational stress: What happens when a price is missing, an order is rejected or trading is interrupted?
Whipsaws are part of the strategy’s economics. Repeated small losses or missed rebounds can occur when prices oscillate around a threshold. Adding filters may reduce some trades, but it can also delay participation in the next sustained move.
After historical testing, run the unchanged process in paper trading. This can reveal scheduling errors, incorrect quantities and reconciliation problems, although simulated fills are not proof of achievable live execution.
Monitor exceptions without rewriting the strategy
Once systematic trend following is live, monitoring should distinguish investment outcomes from implementation failures. A losing trade does not prove a malfunction, and a profitable trade does not prove correct execution.
Compare the intended portfolio with actual holdings after every rebalance. Review unexplained differences in quantities, cash balances and order status. Record estimated versus realized trading costs so that future assumptions reflect experience.
Set explicit boundaries for intervention. A broken data feed, duplicate order or breached exposure cap can justify an operational pause. Disliking the latest signal is not the same kind of event.
Coordination matters when you are unavailable, too. Business travelers may arrange chauffeur support for scheduled business travel to reduce logistical interruptions, but a trading process still needs a fallback if a meeting overruns or connectivity fails. Define who can pause execution and what happens when nobody can review an exception.
Keep strategy changes separate from routine monitoring. Record the proposed change, its rationale and the evidence required before adoption. Changing the lookback after every uncomfortable reversal replaces a systematic process with discretionary reactions.
A practical operating record contains the strategy version, expected orders, actual fills, unresolved exceptions and approval history. It should make the next review straightforward without relying on memory.
Use portfolio intelligence as context, not an override
Verified holdings can help you understand portfolio concentration and compare allocations with other investors. They do not automatically reveal another investor’s entry logic, hedges, tax position or intended holding period.
For systematic trend following, portfolio intelligence is most useful as a separate diagnostic layer. If your holdings appear diversified but concentrate in the same sector as many other portfolios, that observation can prompt a review of your exposure constraints. It should not silently replace the signal rule.
Upside’s portfolio comparison tools let investors examine verified holdings and compare portfolios through private, anonymous profiles. Its trend tracking and return and Sharpe metrics can support further investigation, provided comparisons account for differences in risk and measurement periods.
Avoid copying the current top performer without understanding the path to that ranking. Strong recent returns may reflect concentrated exposure, favorable timing or risks your own rules prohibit. A ranking is a starting point for analysis, not an executable trading instruction.
Maintain a clear boundary: external observations generate research questions, while the approved specification determines live orders.
Frequently asked questions
Does systematic trend following require automated trading? No. You can calculate signals and place orders manually if you follow a documented schedule and consistent rules. Automation can reduce repetitive work, but it also requires controls for bad data, duplicate submissions and connection failures.
How is it different from momentum investing? Trend following commonly evaluates an asset against its own price history, often called time-series momentum. Cross-sectional momentum ranks assets against one another. They can overlap, but their selection rules and exposure during broad market declines can differ.
Can a monthly system control losses during a sudden crash? It may reduce exposure after its scheduled signal changes, but it cannot guarantee protection before or during a sudden decline. Monthly decisions can lag rapid moves. Additional risk controls must be specified and tested rather than assumed.
What should happen when a trend signal conflicts with another investor’s holdings? Follow the approved rules for the live strategy. Investigate the disagreement separately, because another portfolio may have different objectives, constraints or information. Any resulting strategy change belongs in a documented research and validation process.
Build an auditable process before committing capital
The practical test of systematic trend following is whether you can trace each trade from its source data through its signal, target weight and completed execution. Begin with a small universe, realistic cost assumptions and explicit exception handling.
Use portfolio comparisons to challenge concentration and improve your research questions, not to bypass your rules. Before risking capital, confirm that the process can handle an ordinary rebalance and a failed one.