Investing Insights That Improve Better Decisions
More data does not automatically create better investing decisions. Most retail investors already have access to price charts, earnings calendars, analyst opinions, fund factsheets, social feeds, and breaking news. The harder problem is knowing which signals deserve attention, which ones are noise, and how to turn useful information into a repeatable decision process.
That is where investing insights matter. A real insight does more than describe what happened. It helps you understand why something may matter, how it compares with alternatives, and what action, if any, is worth considering. The goal is not to predict every move in the market. The goal is to make fewer impulsive decisions, ask better questions, and build a portfolio process that can survive changing conditions.
For individual investors, the most useful investing insights usually come from combining three things: portfolio context, investor behavior, and risk awareness. When you can see what is changing across verified portfolios, compare your own allocation against relevant peers, and understand the trade-offs behind performance, you are less likely to chase headlines and more likely to make decisions with discipline.
What makes an investing insight useful?
A useful insight is not just interesting. It is decision-grade. That means it can help you decide whether to add, trim, hold, rebalance, research further, or do nothing.
Good investing insights usually have four qualities. They are observable, meaning they are based on evidence rather than speculation. They are contextual, meaning they are compared against a benchmark, a peer group, or a time period. They are repeatable, meaning you can monitor them again in the future. They are actionable, meaning they connect to a specific portfolio decision.
A headline such as investors are buying AI stocks is too broad to be useful on its own. A stronger insight would ask which investors are buying, whether their position sizes are increasing, whether the buying is concentrated in a few names or spread across the theme, whether the trade is already crowded, and whether it fits your own risk tolerance.
| Insight type | What it can reveal | Decision it can support | Main watch-out |
|---|---|---|---|
| Portfolio allocation | Where capital is concentrated | Rebalancing, diversification, risk review | May hide overlap inside funds |
| Ownership changes | Who is accumulating or reducing exposure | Research priorities, conviction checks | Data can lag or lack motive |
| Trend and momentum | Where investor attention is building | Watchlists, timing discipline | Crowded trades can reverse quickly |
| Risk-adjusted returns | Whether returns came with excess volatility | Benchmarking, manager or strategy evaluation | Short time periods can mislead |
| Peer comparison | How your portfolio differs from similar investors | Gap analysis, idea generation | Copying others without context is risky |
The key is to treat insights as inputs, not instructions. Even strong signals should be filtered through your time horizon, liquidity needs, tax situation, and overall portfolio construction.
Start with the decision, not the data
Many investors begin by collecting information, then try to decide what it means. A better process starts with the decision you are trying to make.
Before looking for data, define the question. Are you deciding whether to buy a stock, hold through volatility, reduce concentration, add a new sector, or compare your returns with others? Each question needs different evidence.
For example, if you are deciding whether to add to an existing holding after a price decline, recent price action is only one part of the picture. You may also want to know whether other investors are increasing or reducing exposure, whether the company-specific thesis has changed, whether the stock is still aligned with your target allocation, and whether adding would make your portfolio too concentrated.
If you are deciding whether your portfolio is too aggressive, top performers or trending trades may be less relevant than drawdown history, sector exposure, cash position, volatility, and overlap between holdings. The same data point can be useful or useless depending on the decision it is meant to support.
A simple pre-decision checklist can help:
- What decision am I trying to make? Define the action before searching for evidence.
- What would change my mind? Identify the data that would actually affect your conclusion.
- What benchmark matters? Compare against a relevant index, goal, strategy, or peer group.
- What is the risk of being wrong? Consider downside, concentration, liquidity, and opportunity cost.
- When will I review this? Set a time or trigger so the decision does not become emotional later.
This approach keeps you from collecting random facts that only confirm what you already want to believe.
Verified behavior can be more valuable than opinions
Investors often learn from what other people say, but words can be cheap. A social post, analyst clip, or bullish comment does not always show real conviction. Portfolio behavior can be more informative because it reflects actual capital allocation.
That does not mean you should blindly copy another investor. It means that verified holdings can help you see patterns that opinions alone may miss. If a group of strong performers is steadily increasing exposure to a sector, that may be worth investigating. If a popular trade is held in tiny position sizes, it may be more of a watchlist idea than a high-conviction bet. If investors are selling a stock while public commentary remains optimistic, that divergence may deserve attention.
Ownership data is especially helpful when it is interpreted carefully. Insider ownership, institutional ownership, retail positioning, float, dilution, and short interest can all add context, but none of them should be read in isolation. For a deeper breakdown of signals worth monitoring, Upside Invest has a guide to stock ownership data every investor should track.
The point is not to find a perfect guru. It is to observe patterns across real portfolios and use them to sharpen your own research. A verified investor move can become a research prompt: why are they adding, what risks might they see differently, and is the position consistent with their broader strategy?
Context turns raw performance into insight
Performance numbers can be misleading without context. A portfolio that gained 25 percent may look impressive until you learn it took extreme concentration risk during a speculative market. Another portfolio with lower returns may be more attractive if it produced steadier results with less volatility and better downside control.
This is why benchmarking matters. Comparing your portfolio only against a broad index can be useful, but it may not answer the full question. A dividend investor, a crypto-heavy investor, a concentrated growth investor, and a balanced ETF investor should not all use the same comparison framework.
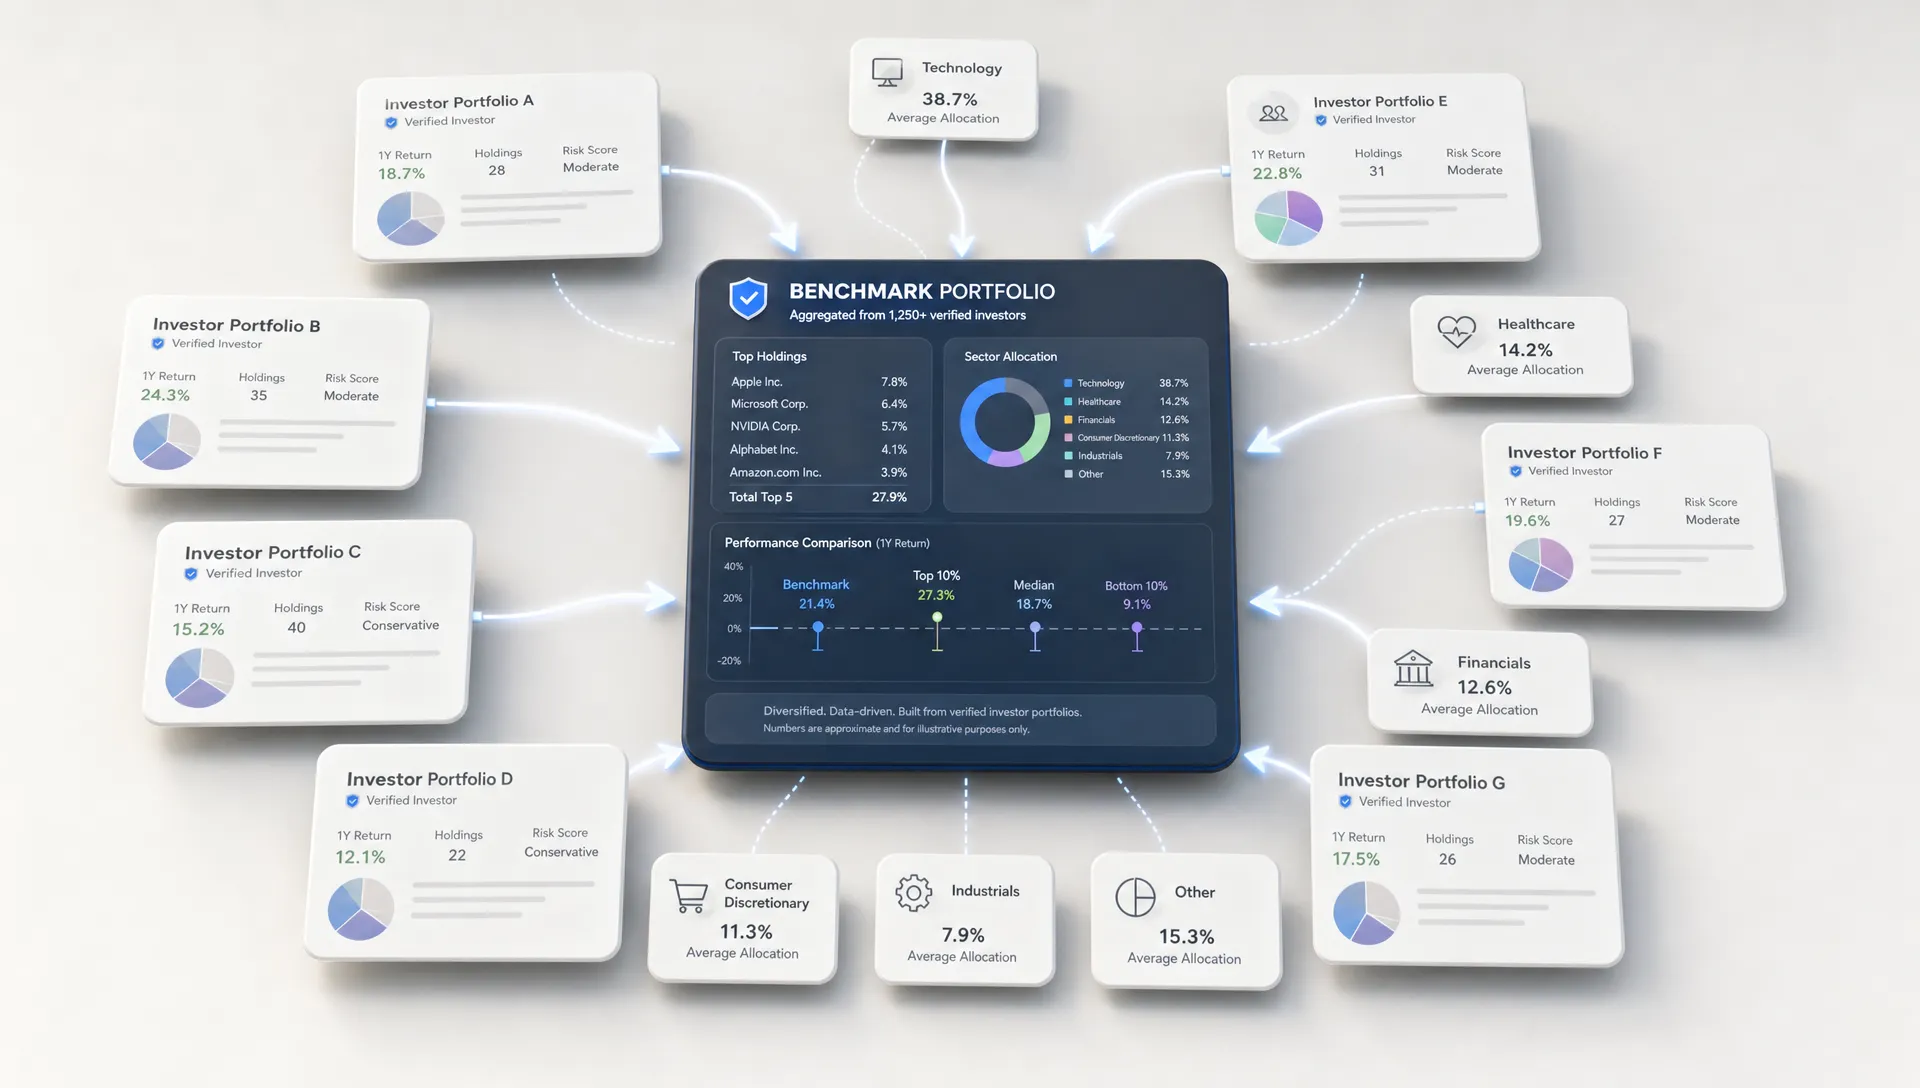
A more meaningful benchmark may include investors with similar goals, risk levels, account sizes, asset classes, or time horizons. Seeing how your allocation compares with verified investors can reveal whether your performance came from skill, market exposure, concentration, or simply owning the same winners as everyone else. Upside Invest explains this idea further in its article on how to benchmark your portfolio against verified investors.
Risk-adjusted metrics can also improve the quality of your investing insights. Return alone tells you what happened. Metrics such as volatility, maximum drawdown, and Sharpe ratio help you understand how bumpy the path was. No single metric is complete, but combining them can prevent you from mistaking high risk for high skill.

A practical workflow for turning insights into decisions
The best investing insights are connected to a process. Without a workflow, even useful data can become entertainment. With a workflow, the same data can help you act more calmly and consistently.
Use the following structure whenever a signal catches your attention:
| Step | Question to ask | Example |
|---|---|---|
| Signal | What changed? | Verified investors are adding to a sector, or your allocation has drifted above target |
| Context | Compared with what? | Relative to your benchmark, peer group, prior allocation, or risk limit |
| Explanation | Why might it be happening? | Earnings revisions, macro changes, valuation reset, new product cycle, or sentiment shift |
| Risk | What could make this wrong? | Crowding, leverage, deteriorating fundamentals, liquidity, or correlation with existing holdings |
| Decision rule | What will I do? | Add gradually, hold, trim, rebalance, research further, or set an alert |
| Review | When will I revisit it? | After earnings, after a price level, after allocation drift, or at a monthly review |
This framework protects you from the common mistake of jumping from signal to action. A trend is not automatically a buy. A selloff is not automatically an opportunity. A top performer is not automatically someone to copy.
A decision-grade process creates space between information and action. That space is where better investing decisions happen.
Beware of insight traps that feel smart
Some investing insights feel sophisticated but still lead to poor decisions. The danger is greatest when data confirms an existing belief or when a popular trade creates social pressure.
Confirmation bias is one of the most common traps. If you already like a stock, you may focus on bullish ownership signals and ignore signs of weakening fundamentals. If you dislike a sector, you may dismiss strong accumulation as temporary hype. Better investors deliberately look for disconfirming evidence before acting.
Recency bias is another problem. A trade that worked over the last three months can look obvious in hindsight, but the conditions that made it work may already be fading. Momentum can be useful, but only when combined with position sizing, valuation, catalyst analysis, and risk controls.
There is also the trap of copying without understanding. If a high-performing investor owns a stock, that does not mean it belongs in your portfolio. They may have a different cost basis, time horizon, hedging strategy, tax situation, or tolerance for drawdowns. Their 2 percent position may not justify your 15 percent allocation.
Decision quality also improves through practice. In business education, managers often use tools such as experiential business simulation software to test strategic choices, receive feedback, and learn from outcomes before facing real-world consequences. Investors can apply a similar principle by paper tracking ideas, reviewing past decisions, and building feedback loops instead of relying on memory.
What to track if you want better investing insights
A strong investment process does not require tracking everything. In fact, tracking too much can create noise. Focus on the data that helps you understand portfolio behavior, risk, and changing conviction.
For most retail investors, the most useful signals include allocation by asset class, sector, and theme; position size changes over time; overlap across funds and individual stocks; realized and unrealized gains; volatility and drawdowns; investor buying and selling trends; and alerts tied to major portfolio moves.
The goal is to connect each signal to a decision. If you track sector exposure, decide what level of concentration is too high. If you monitor verified investor moves, decide what kind of move is large enough to trigger research. If you follow top performers, compare their risk and allocation patterns, not only their returns.
This is where platforms like Upside Invest can help retail investors move from scattered information to structured comparison. Upside focuses on verified investor holdings, anonymous profiles, portfolio comparison, trend tracking, top performer rankings, return and Sharpe metrics, investor move alerts, and stock, fund, and crypto views. Used thoughtfully, that kind of portfolio intelligence can help you see what others are actually holding while keeping the focus on your own decision process.
A simple example: from signal to decision
Imagine you notice that several verified investors with strong recent risk-adjusted returns have added exposure to cybersecurity stocks. That is a signal, but it is not yet an insight.
To turn it into an insight, you would check whether the buying is broad or concentrated in one name. You would compare the position sizes with their overall portfolios. You would look at whether your own portfolio already has indirect exposure through technology funds. You would review valuation, earnings momentum, and potential catalysts. You would also ask what could go wrong, such as crowded positioning, budget pressure, or slowing revenue growth.
Only then does the decision become clearer. You might add one stock to a watchlist, increase exposure gradually through a fund, decide you already have enough technology exposure, or set an alert for future investor moves. Each outcome is valid if it follows a disciplined process.
That is the difference between reacting to data and using investing insights well.
Frequently Asked Questions
What are investing insights? Investing insights are evidence-based observations that help investors make clearer decisions about allocation, risk, timing, and research priorities. They can come from portfolio data, ownership trends, investor behavior, valuation, fundamentals, and performance metrics.
How are investing insights different from stock tips? A stock tip usually points to a specific buy or sell idea without much context. An investing insight helps you understand why a signal matters, how it fits your portfolio, and what decision process you should follow.
Should I copy top-performing investors? No. Top-performing investors can be useful sources of ideas, but copying them without understanding their risk profile, time horizon, position size, and strategy can be dangerous. Use their behavior as a research input, not as a command.
Which metrics matter most for better investment decisions? Useful metrics include allocation, position size, benchmark comparison, volatility, drawdown, return, Sharpe ratio, ownership changes, and portfolio overlap. The best metric depends on the decision you are trying to make.
Can investing insights reduce risk? They can help you identify hidden risks such as concentration, overlap, crowding, and volatility, but they cannot eliminate market risk. Better insights improve your process, not your certainty.
Turn insight into a stronger investing process
Better investing decisions rarely come from one perfect signal. They come from a repeatable process that combines real portfolio data, context, risk awareness, and disciplined review.
If you want to compare your portfolio with verified investors, spot allocation trends, track investor moves, and make more informed decisions with privacy in mind, explore Upside Invest. Use insights as a guide, not a shortcut, and let better context improve every decision you make next.