Portfolio Comparison Tips That Reveal Hidden Risk
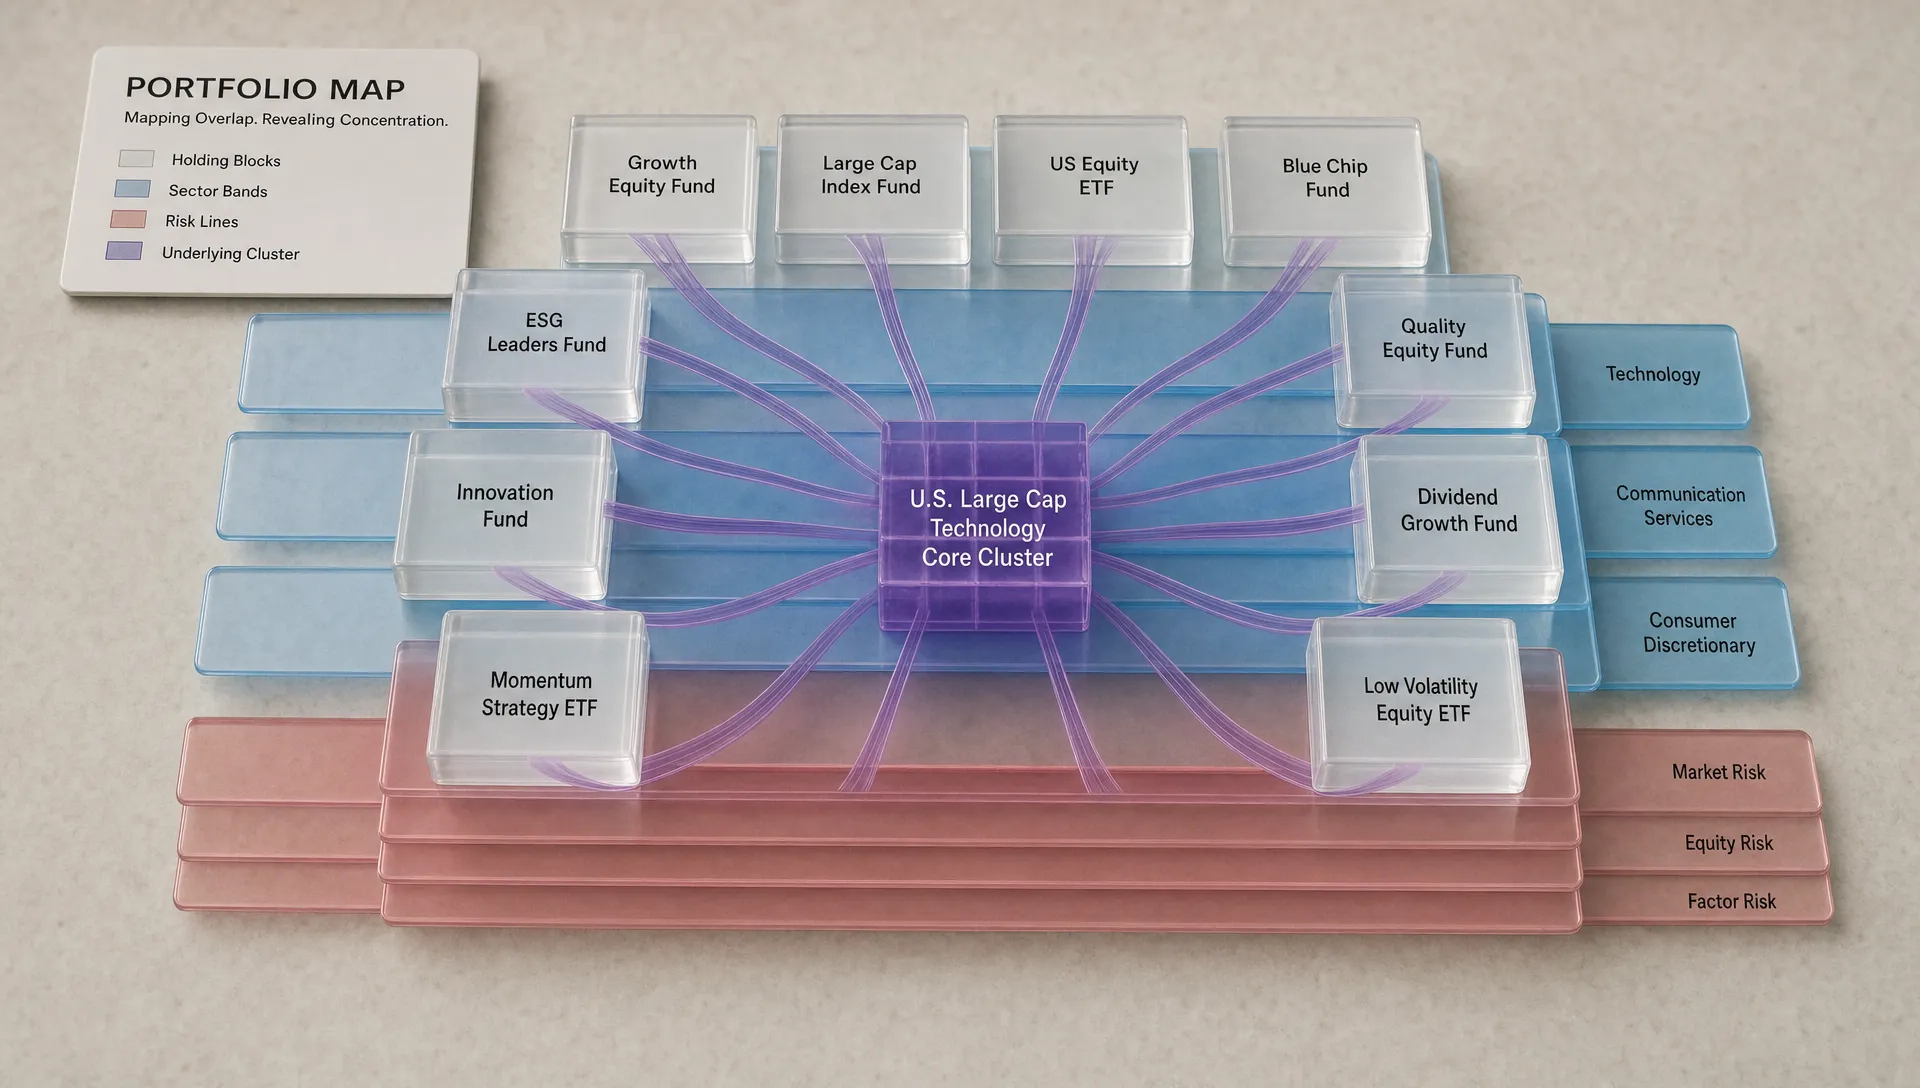
Most investors compare portfolios by looking at returns. That is understandable, but it is also where many hidden risks stay hidden. A portfolio can outperform for six months because it is genuinely well built, or because it is accidentally overloaded with the same market bet in five different wrappers.
Good portfolio comparison is not about copying someone else’s allocation. It is about asking better questions: What risk am I really taking? Which holdings behave the same way? What would hurt me if the market moved against my assumptions? And how does my portfolio compare with investors who have similar goals, time horizons, and risk tolerance?
Below are practical portfolio comparison tips that can help retail investors uncover hidden risk before it becomes obvious in a drawdown.
Start With a Real Benchmark, Not a Vague Goal
The first mistake in portfolio comparison is comparing against the wrong thing. If your goal is long-term wealth building, comparing your portfolio to a hot stock, a crypto rally, or a friend’s lucky trade can push you toward unnecessary risk.
A useful benchmark should match the role your portfolio is supposed to play. For example, a young investor with a 20-year horizon might compare against a global equity index. A retiree drawing income might compare against a balanced stock and bond allocation. A sector-focused investor might compare against a sector ETF rather than the S&P 500.
Your benchmark does not have to be perfect, but it should be consistent. Once you choose it, compare more than performance. Look at volatility, drawdowns, concentration, sector exposure, and how the portfolio behaves in different market environments.
A simple benchmark test is this: if your portfolio beats the benchmark, can you explain why? If the answer is “because I owned more of the same stocks that happened to go up,” that is not necessarily skill. It may be concentrated exposure.
Look Through Funds to Find Overlapping Holdings
Many investors believe they are diversified because they own several ETFs or mutual funds. The problem is that different funds can hold many of the same underlying companies.
For example, an investor might own a broad U.S. index fund, a large-cap growth ETF, a technology ETF, and individual shares of major tech companies. On paper, that looks like several positions. In reality, the portfolio may be highly dependent on the same handful of mega-cap stocks.
This is one of the most important portfolio comparison checks because overlap can quietly increase risk. Two portfolios with the same number of tickers can have very different levels of diversification.
| Comparison check | What it reveals | Hidden risk to watch |
|---|---|---|
| Top 10 holdings across all funds | Whether the same companies dominate multiple positions | Accidental single-stock concentration |
| Sector weight after fund look-through | Your true economic exposure | Overdependence on one industry |
| Market-cap exposure | Whether you are tilted toward large, mid, or small companies | Too much reliance on one market segment |
| Region and currency exposure | Where revenue and market risk actually come from | Unnoticed country or currency concentration |
If you use portfolio comparison tools, prioritize ones that help you see through the labels. “Growth ETF,” “innovation fund,” and “technology fund” may sound different, but their holdings can overlap heavily.
Compare Position Size to Portfolio Impact
A position’s risk is not just about how volatile the asset is. It is also about how much of your portfolio it represents.
A 2% position in a speculative stock may be manageable. A 25% position in the same stock can dominate your financial outcome. The same applies to thematic ETFs, crypto assets, leveraged funds, and employer stock.
When comparing your portfolio to another investor’s, do not only ask, “Do we own the same thing?” Ask, “How much does it matter to each portfolio?”
One useful exercise is to calculate how much your total portfolio would fall if a position dropped 50%. If a single holding could reduce your portfolio by 10% or more, you are making a major bet, whether or not you intended to.
This is especially important for investors who accumulate shares over time. A winning position can become oversized simply because it appreciated. That may feel like a good problem, but it still changes your risk profile.
For a deeper understanding of what stock ownership actually represents, Upside’s guide to what share of ownership means for everyday investors is a useful companion to this kind of position-level analysis.
Compare Risk-Adjusted Returns, Not Just Total Returns
Two portfolios can both return 12%, but one may have taken far more risk to get there. That difference matters.
Risk-adjusted comparison helps you understand whether a portfolio’s return was efficient. Common metrics include volatility, maximum drawdown, and the Sharpe ratio. The Sharpe ratio compares excess return to volatility, making it easier to evaluate whether higher returns came with proportionally higher risk.
According to the U.S. Securities and Exchange Commission, diversification helps reduce risk by spreading investments across different assets, but it does not eliminate risk entirely. That is why comparing the quality of returns matters as much as comparing the returns themselves.
Here is a simple way to think about it:
| Portfolio result | Surface interpretation | Better question |
|---|---|---|
| High return, high volatility | “This investor is outperforming.” | Would I stay invested through the swings? |
| Moderate return, low volatility | “This portfolio is boring.” | Is the risk-adjusted outcome actually stronger? |
| Strong recent return, deep drawdown history | “It recovered well.” | Could I tolerate the next drawdown? |
| Smooth return, concentrated holdings | “It seems safe.” | Is the calm period masking hidden exposure? |
A portfolio that looks impressive in a bull market may be fragile in a market rotation. Risk-adjusted comparison helps separate durable strategy from temporary momentum.
Check Correlations During Stress, Not Just Normal Markets
Correlation measures how assets move in relation to one another. Many investors check correlation during normal periods, but hidden risk usually appears during stress.
Assets that seem diversified in calm markets can fall together during liquidity shocks, recession fears, or sudden interest-rate changes. Stocks, high-yield bonds, real estate investment trusts, and crypto can all become more correlated when investors rush to reduce risk.
This does not mean diversification is useless. It means you should compare how holdings behaved in difficult periods, not only during average conditions.
Look at how your portfolio performed during events such as:
- The 2020 COVID market crash
- The 2022 inflation and rate-hike selloff
- Sector-specific drawdowns, such as banking, energy, or technology declines
- Periods when bonds and stocks both struggled
If your portfolio has no history because you recently built it, use proxies. Compare similar funds, sectors, or asset classes. The goal is not to predict the next crisis perfectly. It is to avoid assuming that different tickers automatically mean different risks.
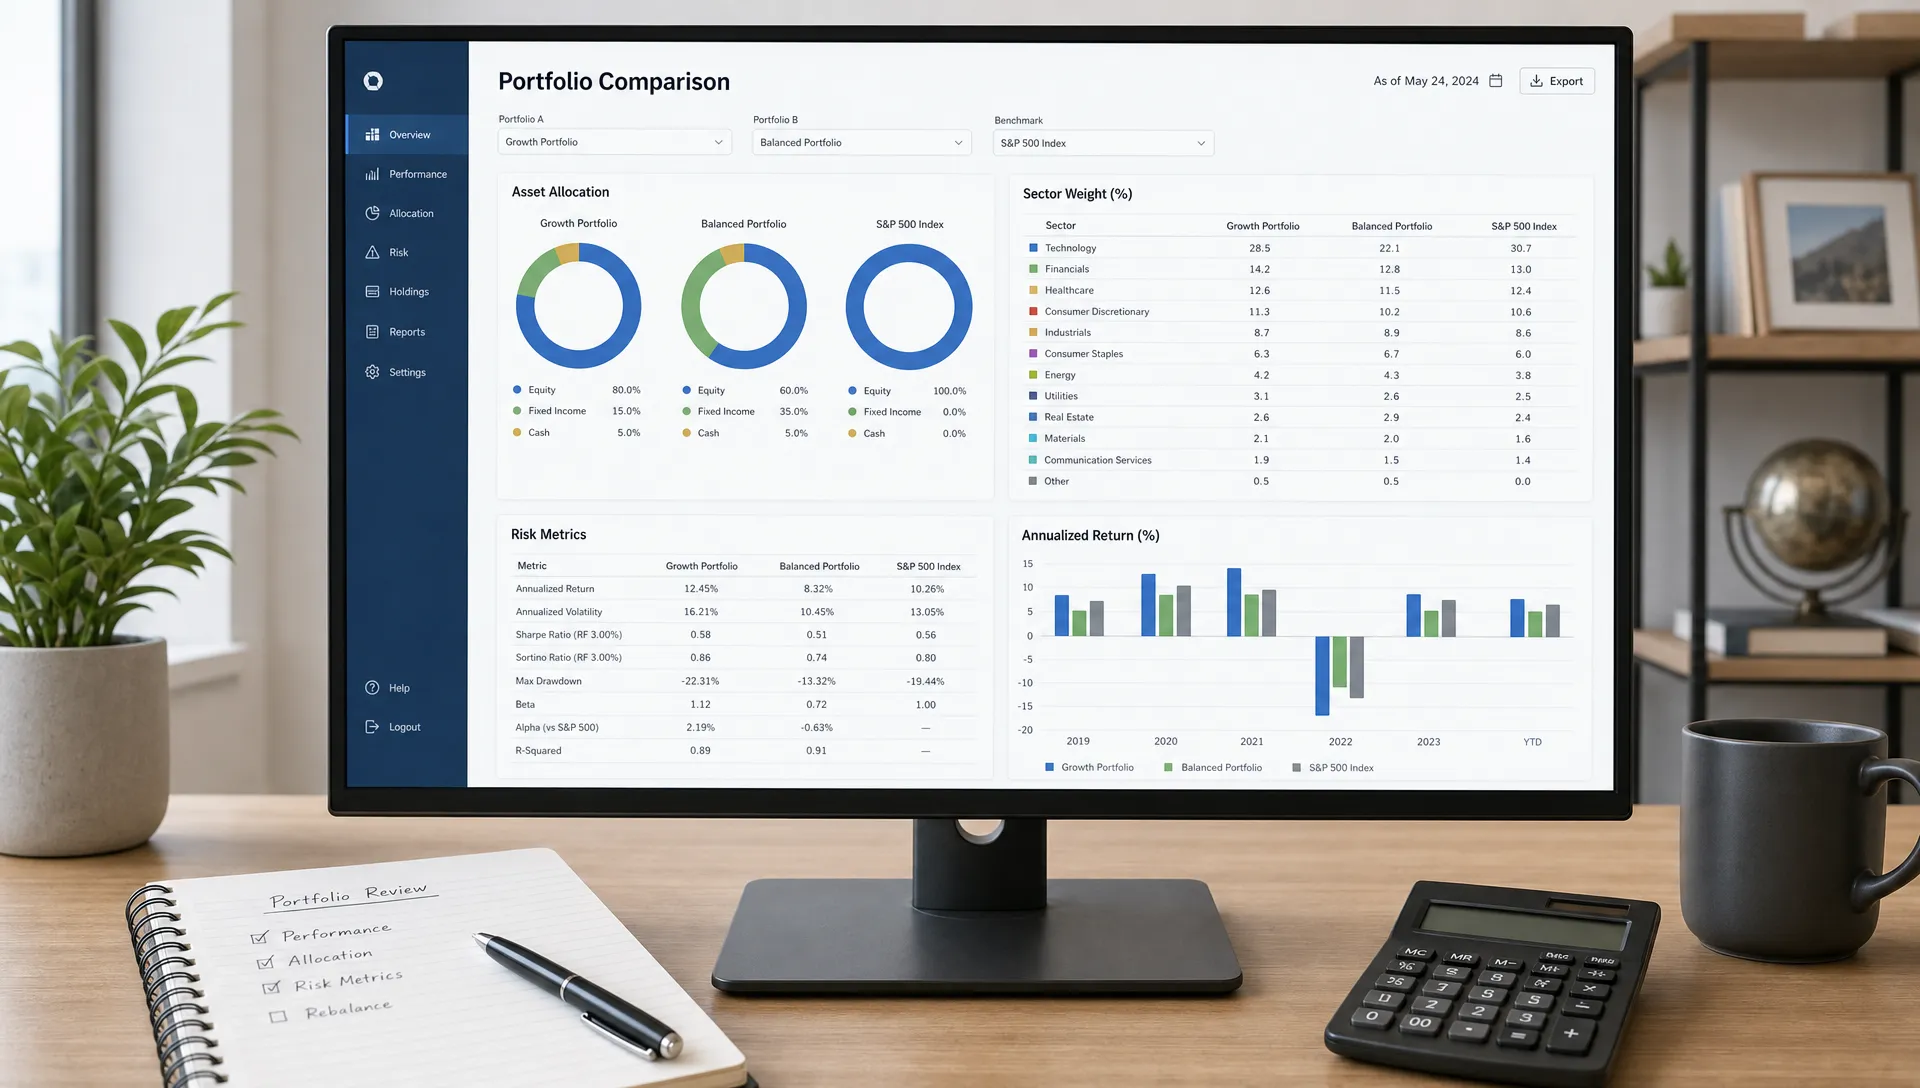
Compare Sector Exposure Against Your Income and Life Risks
Portfolio risk does not exist in isolation. Your job, income, home equity, business ownership, and future spending needs all affect your real exposure.
For example, a technology employee who owns company stock, receives stock-based compensation, and invests heavily in technology ETFs may have more tech exposure than their brokerage account alone suggests. An energy worker with energy stocks faces a similar issue. If the sector weakens, both income and investments may be pressured at the same time.
This is where portfolio comparison becomes personal. A portfolio that is reasonable for one investor may be risky for another because their financial lives are different.
When comparing your allocation, ask:
- Does my portfolio depend on the same industry as my paycheck?
- Am I exposed to the same local economy through my job and real estate?
- Do I own a lot of employer stock or business equity?
- Would a recession affect my income and my portfolio at the same time?
If the answer is yes, your investment portfolio may need more diversification than someone with a different career or balance sheet.
Watch for Theme Stacking
Theme stacking happens when multiple holdings express the same underlying belief. It is common because investors naturally buy ideas they find compelling.
For instance, an investor bullish on artificial intelligence might own semiconductor stocks, cloud companies, automation ETFs, large-cap growth funds, and venture-style innovation funds. These holdings may look different, but they could all depend on the same market narrative: AI growth will exceed expectations and valuations will remain elevated.
Theme stacking is not always bad. Concentrated themes can produce strong returns when the thesis is right. The risk is that investors often underestimate how much of the portfolio depends on one idea.
A good portfolio comparison exercise is to group holdings by thesis rather than asset label. Instead of listing “ETF, stock, fund, crypto,” try grouping by what must go right for the investment to work.
| Theme | Example exposure | Risk if the theme reverses |
|---|---|---|
| AI and automation | Semiconductors, cloud, software ETFs | Valuation compression and earnings disappointment |
| Lower interest rates | Long-duration bonds, REITs, growth stocks | Losses if rates stay higher for longer |
| Consumer resilience | Retail, travel, discretionary stocks | Weakness if household spending slows |
| Inflation protection | Commodities, energy, real assets | Underperformance if inflation falls quickly |
This view often reveals that a portfolio is less diversified than it appears.
Compare Your Portfolio With Verified Investors, Not Just Online Opinions
Online discussions can be useful for discovering ideas, but they are not the same as verified portfolio comparison. Many people talk confidently about positions they do not own, positions they sold, or trades that represent a tiny part of their portfolio.
Sentiment tools and community monitoring platforms, including AI tools for finding relevant Reddit conversations, can help investors understand what people are discussing. But discussion volume is not conviction, and conviction is not the same as allocation.
That is why verified holdings matter. Seeing what investors actually hold, how large those positions are, and how their portfolios perform gives you a more grounded comparison than reading isolated comments.
Upside Invest is built around this idea: anonymous portfolio sharing based on verified investor holdings, so users can compare allocations, identify trends, and learn from real portfolio behavior without exposing personal identity. You can explore anonymous portfolio comparison on Upside when you want to benchmark against actual investor positioning rather than anecdotes.
Compare Buying Behavior, Not Only Current Holdings
A portfolio snapshot is useful, but movement can be even more revealing. What are investors adding to? What are they trimming? Are top performers becoming more concentrated, or are they rebalancing after gains?
Current holdings show where a portfolio stands today. Buying and selling behavior shows how investors respond to new information.
For example, two investors may both own the same stock. One may be adding after strong earnings because their thesis improved. Another may be reducing because the position became too large. Without behavior, you might assume both investors have the same view.
When comparing portfolios, look for changes in:
- Position size over time
- Sector rotation
- New holdings entering the portfolio
- Concentration increasing or decreasing
- Cash levels rising or falling
This is particularly helpful when comparing against top performers. Outperformance is not just about what they own today. It may come from how they size positions, when they rebalance, and how they manage losers.
Stress-Test Your Portfolio With Simple Scenarios
You do not need institutional software to run a basic stress test. The point is to imagine plausible market moves and estimate how your portfolio might respond.
Start with scenarios that match current risks. In 2026, investors continue to pay attention to interest-rate expectations, AI-related valuations, global growth, inflation trends, and geopolitical shocks. Your stress tests should reflect the exposures you actually have.
Try asking what happens if:
- Your largest stock falls 40%
- Your top sector underperforms the market by 25%
- Interest rates rise instead of fall
- The U.S. dollar strengthens sharply
- Crypto assets drop 50%
- A recession reduces earnings across cyclical companies
You do not need exact predictions. Even rough estimates can reveal whether too much of your portfolio depends on one outcome.
A useful rule: if one realistic scenario would force you to abandon your plan, the risk is probably too high.
Compare Liquidity and Exit Risk
Liquidity risk is easy to ignore when markets are calm. It becomes important when you need to sell.
Large-cap stocks and major ETFs usually have deep markets. Smaller stocks, niche funds, certain crypto assets, private investments, and thinly traded securities may be harder to exit at a fair price during stress.
When comparing portfolios, liquidity matters because two investors can hold assets with similar expected returns but very different flexibility. If you need cash for a home purchase, tuition, retirement withdrawals, or emergency reserves, liquidity should be part of your risk comparison.
Ask yourself whether each position can be sold quickly without a large price impact. Also consider tax consequences. A highly appreciated position may be technically liquid but psychologically difficult to sell because of capital gains taxes.
Beware of Performance Chasing in Peer Comparison
Portfolio comparison is powerful, but it can become dangerous when it turns into performance chasing. Seeing another investor outperform can create pressure to copy their holdings without understanding their time horizon, risk tolerance, or original entry price.
The entry price matters. A stock that is a high-conviction 3% position for someone who bought years ago may be a very different risk for someone buying today after a large rally.
The holding period matters too. Some investors can tolerate years of volatility because they have a long horizon and stable income. Others cannot. Copying the asset without copying the context can lead to poor decisions.
A healthier approach is to compare for insight, not imitation. Use other portfolios to discover questions you have not asked, risks you have not measured, and opportunities you may want to research further.
Build a Portfolio Comparison Checklist
A consistent checklist prevents you from focusing only on recent winners. Use it monthly or quarterly, and especially before adding a new position.
| Checklist item | Why it matters |
|---|---|
| Benchmark fit | Confirms you are comparing against the right standard |
| Top holding concentration | Reveals whether one position dominates results |
| Fund overlap | Shows hidden duplication across ETFs and funds |
| Sector and theme exposure | Identifies crowded bets and narrative risk |
| Correlation in stress periods | Tests whether diversification may fail under pressure |
| Risk-adjusted return | Separates efficient performance from volatile performance |
| Liquidity and tax constraints | Highlights risks that appear when you need to sell |
| Behavior over time | Shows whether investors are adding, trimming, or rotating |
The best checklist is simple enough to use repeatedly. Complexity is less important than consistency.
Frequently Asked Questions
What is portfolio comparison? Portfolio comparison is the process of evaluating one portfolio against a benchmark, peer group, or another investor’s portfolio. It looks beyond returns to compare allocation, concentration, volatility, sector exposure, risk-adjusted performance, and behavior over time.
Why can portfolio comparison reveal hidden risk? Hidden risk often comes from overlap, concentration, correlation, and theme stacking. A portfolio may look diversified because it has many holdings, but comparison can reveal that those holdings depend on the same sectors, stocks, or market assumptions.
How often should I compare my portfolio? For most long-term investors, a quarterly review is enough. You may want to compare more often after major market moves, large deposits, job changes, or when one position grows large enough to change your overall risk profile.
Should I copy top-performing investors? Not blindly. Top-performing investors may have different goals, entry prices, risk tolerance, and time horizons. It is better to use their portfolios as research inputs and compare their allocation decisions with your own plan.
What is the biggest mistake in portfolio comparison? The biggest mistake is comparing returns without comparing risk. A higher-return portfolio may simply be more concentrated, more volatile, or more exposed to a single market theme.
Turn Portfolio Comparison Into Better Decisions
Hidden risk usually becomes obvious only after losses. A better process can help you spot it earlier.
Compare your portfolio against a relevant benchmark, look through funds for overlap, measure concentration, review risk-adjusted performance, and pay attention to how verified investors are actually allocating capital. The goal is not to eliminate risk. Investing always involves risk. The goal is to make sure the risks you take are intentional, understandable, and aligned with your financial life.
With Upside Invest, you can compare your portfolio with verified investor holdings, track trends, and learn from anonymous community benchmarks while keeping your profile private. Use portfolio comparison as a decision tool, not a scoreboard, and you will be better positioned to manage risk before it surprises you.