Trend Following Strategies That Still Work in 2026
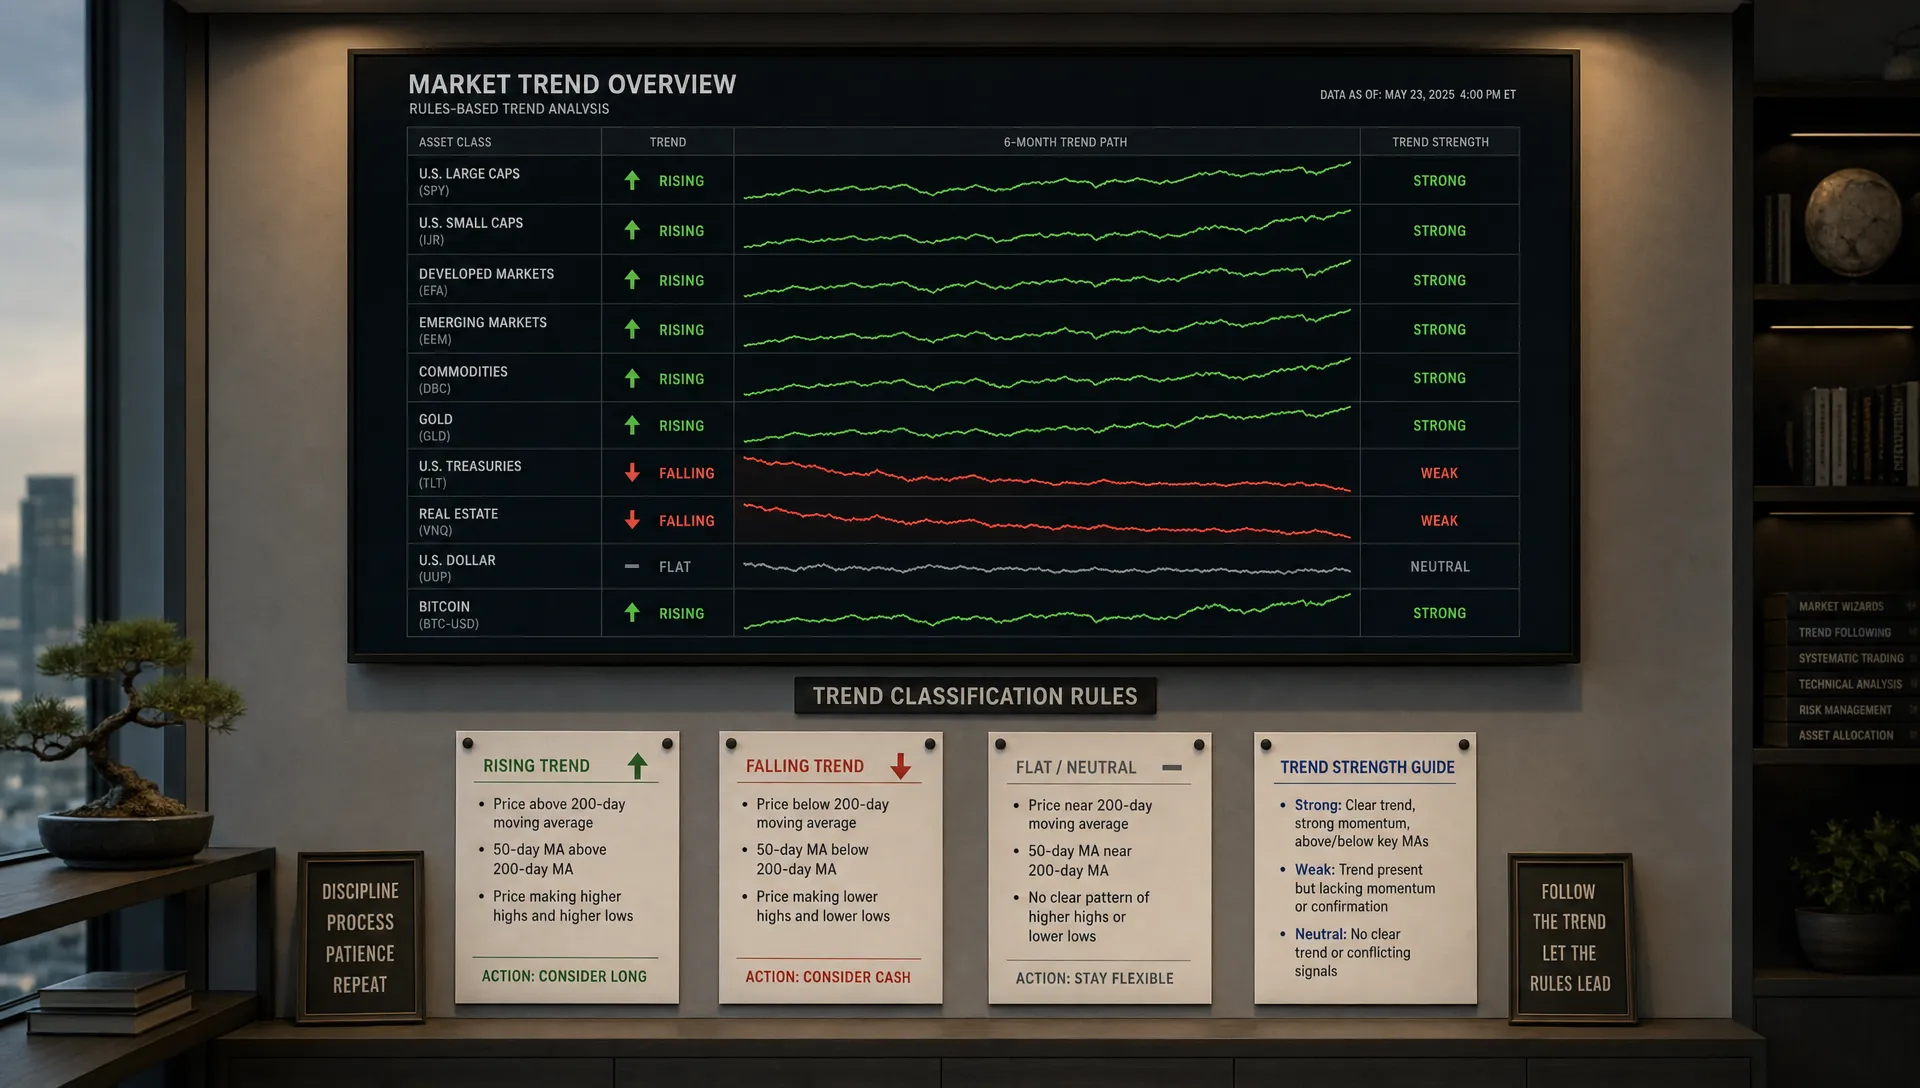
Trend following has survived every market cycle because it is built on a simple observation: prices often continue moving in the same direction longer than investors expect. That does not mean every breakout is tradable, every moving average signal is useful, or every strong stock deserves a spot in your portfolio. In 2026, the edge is not in discovering that trends exist. The edge is in applying trend following strategies with better filters, better risk controls, and better context.
Retail investors now have more data than ever: real-time prices, ETF flows, factor screens, options activity, crypto charts, and investor positioning. More information can help, but it can also create noise. A trend strategy still works when it answers three questions clearly: what counts as a trend, when do you act, and how much risk do you take?
This guide focuses on trend following strategies that still make sense in 2026 for long-term investors, active retail investors, and anyone who wants a rules-based way to avoid emotional decision-making. It is educational, not financial advice, but it should help you build a more disciplined process.
Why trend following still works in 2026
Trend following is not a prediction system. It does not require you to know next quarter’s earnings, the next inflation print, or which central bank official will move markets. It reacts to observable price behavior.
That matters because markets are driven by humans, institutions, rules, and capital flows. Trends can persist for several reasons:
- Investors underreact to new information, then gradually adjust.
- Institutions rebalance slowly because of mandates and liquidity constraints.
- Strong narratives attract additional buyers, which can reinforce momentum.
- Risk controls at funds can force selling into weakness and buying into strength.
- New information is incorporated unevenly across sectors, regions, and asset classes.
The academic case is not new. AQR’s research paper A Century of Evidence on Trend-Following Investing found that trend following has appeared across asset classes and over long historical periods. The practical takeaway is not that trend following always wins. It is that persistent price moves are common enough to justify systematic rules.
What has changed in 2026 is execution. Simple signals are widely known. A 50-day moving average crossover on a single mega-cap stock is not a complete strategy. Investors need to combine trend signals with diversification, position sizing, liquidity awareness, and portfolio-level risk checks.
The core rule: follow price, but do not worship it
Price is the main input in trend following, but it should not be the only input you respect. A stock rising 40 percent in a month may be in a powerful trend, or it may be overextended after a short squeeze. A sector ETF above its 200-day moving average may be healthy, or it may be hiding concentration in two giant holdings.
A modern trend process should separate signal from decision. The signal tells you that momentum exists. The decision considers liquidity, volatility, portfolio overlap, valuation risk, event risk, and your own time horizon.
Here is a simple way to think about the most common signal types:
| Signal type | What it measures | Best use case | Main weakness |
|---|---|---|---|
| Moving average | Whether price is above or below a smoothed trend line | Broad market and ETF trend filters | Whipsaws in sideways markets |
| Time-series momentum | Whether an asset has positive or negative returns over a lookback period | Multi-asset allocation | Can be late after sharp reversals |
| Relative strength | Which assets are outperforming peers | Sector, theme, or stock rotation | Can crowd into expensive leaders |
| Breakout systems | Whether price exceeds a prior high or range | Strong directional markets | False breakouts in low-volume moves |
| Volatility-adjusted trend | Trend signal adjusted for risk | Position sizing and risk control | More complex to maintain |
The best trend following strategies in 2026 usually combine at least two of these ideas. For example, an investor might only buy stocks above their 200-day moving average, then rank eligible names by 6-month relative strength, then size positions based on volatility.
Strategy 1: The 200-day moving average filter
The 200-day moving average remains useful because it is simple, transparent, and slow enough to reduce some noise. The basic rule is straightforward: when an asset is above its 200-day moving average, the trend is positive; when it is below, risk is higher.
This works best as a filter, not as a full trading system. For example, a long-term investor might use it to decide whether to add new capital to an equity ETF, reduce exposure to a weak sector, or avoid averaging down into a falling stock.
The mistake is treating the 200-day line as magic. Markets often dip below it and recover quickly. If you react to every small cross, transaction costs and taxes can erode returns. Many investors reduce whipsaws by checking signals weekly or monthly rather than intraday.
A practical 2026 version could look like this: require price to be above the 200-day moving average and require the slope of the average to be flat or rising. This prevents buying assets that barely reclaim the line while the longer-term trend is still deteriorating.
Strategy 2: Time-series momentum across asset classes
Time-series momentum compares an asset to its own past. A common version looks at the last 6 to 12 months of returns. If the return is positive, the trend is considered positive. If it is negative, the trend is considered weak or bearish.
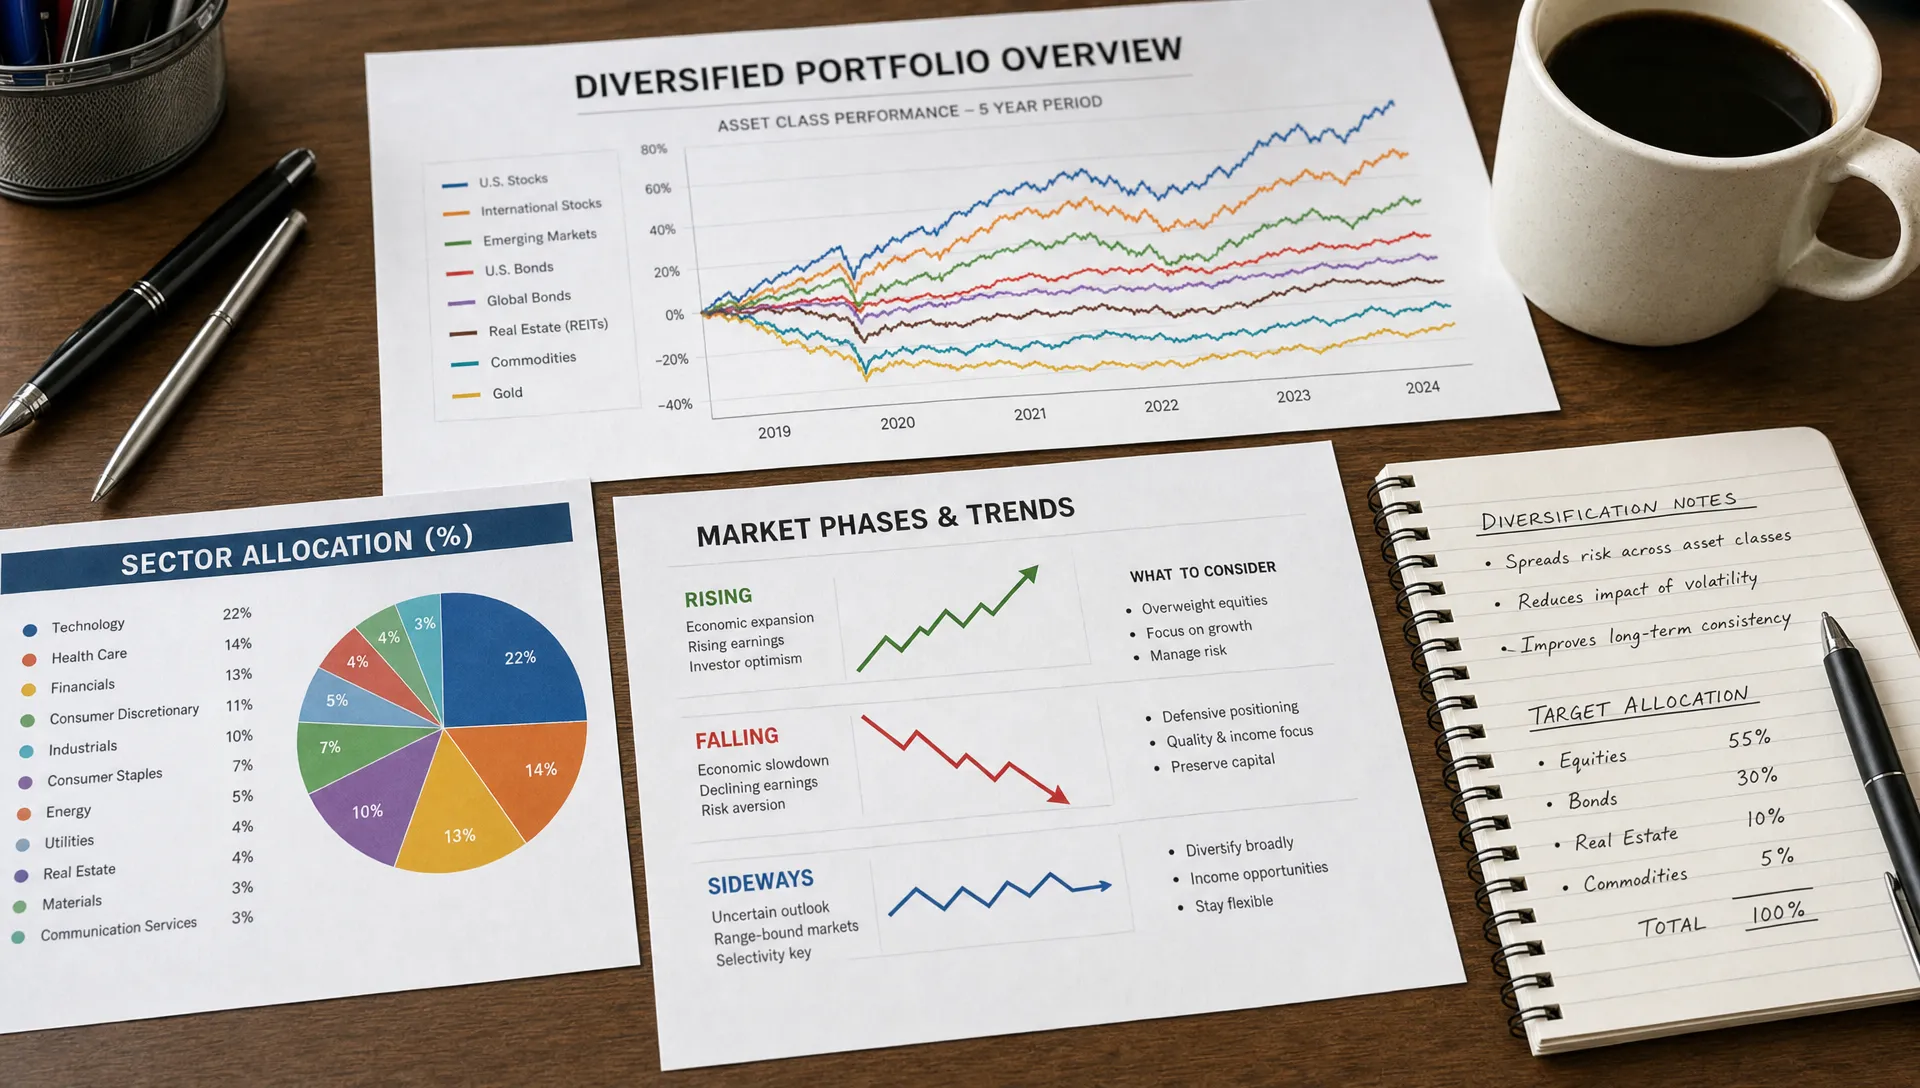
This approach is especially useful across asset classes: equities, bonds, commodities, currencies, real estate, and crypto. The goal is not to find the single best stock. The goal is to participate in broad trends while reducing exposure to persistent downtrends.
Retail investors can adapt this without using leverage or shorting. A simplified long-only version might rank broad ETFs by 12-month return, hold the strongest few, and move weak allocations into cash-like instruments or lower-volatility assets when trends turn negative.
The key is diversification. A trend strategy built only on U.S. growth stocks may look brilliant for years, then struggle when leadership changes. A multi-asset framework gives the system more opportunities to find trends in different environments.
Strategy 3: Relative strength rotation
Relative strength asks a different question: what is outperforming right now? Instead of asking whether a stock is up or down in absolute terms, it ranks assets against peers.
This is useful for sector rotation, theme investing, and watchlist management. In 2026, many investors use relative strength to compare areas such as AI infrastructure, cybersecurity, energy, healthcare innovation, small caps, dividend stocks, crypto assets, and international markets.
A basic process might rank 20 sector or theme ETFs by 3-month and 6-month performance, then focus research on the top group. A more selective investor might require the asset to beat both its peer group and a broad benchmark.
Relative strength works best when paired with portfolio awareness. If your top-ranked themes all depend on the same macro driver, such as falling interest rates or semiconductor demand, you may be less diversified than you think. Before rotating into a hot theme, it is worth reviewing portfolio comparison techniques that reveal hidden risk, especially if you already own overlapping ETFs or funds.
Strategy 4: Breakout trading with volume and volatility filters
Breakout systems buy when price moves above a prior high or trading range. The logic is that a new high can signal fresh demand, especially when it follows a period of consolidation.
This strategy can still work, but it needs stricter filters than it did in slower markets. False breakouts are common, especially in thinly traded stocks, social media-driven names, and crypto tokens with shallow liquidity.
A stronger breakout setup usually has three ingredients: a clear prior range, above-average volume, and volatility that is expanding but not chaotic. If a stock breaks out on weak volume after a vertical move, the risk of reversal is higher.
Breakout traders should also define exits before entry. For example, some use a close back inside the prior range as an exit. Others use a volatility-based stop, such as a multiple of average true range. The specific rule matters less than consistency.
Strategy 5: Trend following with ownership and participation data
Price tells you what is happening. Ownership and participation data can help explain who may be driving it.
This is where 2026 investors have an advantage. You can now look beyond the chart and ask whether a move is supported by insider ownership, institutional accumulation, ETF flows, short interest, or verified investor behavior. None of these data points should override risk management, but they can improve context.
For example, a stock making new highs while institutional ownership rises and short interest falls may have a different risk profile than a stock rising mainly because of a short-lived retail frenzy. Similarly, a sector ETF with strong price momentum and broad participation across holdings may be healthier than one driven by a single mega-cap position.
If you use ownership data as part of your process, focus on changes rather than static numbers. A high ownership percentage is less useful than a meaningful shift in who owns the asset and whether that shift confirms the price trend. Upside’s guide to stock ownership data every investor should track is a useful companion if you want to add this layer without overcomplicating your system.
Markets are not democracies, but they are collective decision systems where transparency can change behavior. The same broader shift toward technology-enabled participation is visible outside markets too, including civic projects focused on continuous direct democracy, and investors can learn from that idea: better visibility into group behavior can improve decision-making, but only when the data is verified and interpreted carefully.
Strategy 6: Verified investor momentum, not blind copy trading
One of the most practical trend following upgrades in 2026 is watching what verified investors are actually holding, adding, or reducing. This is different from following anonymous opinions on social platforms. The useful signal is not what someone says they like. It is what verified portfolios show they own and how those allocations change over time.
That does not mean you should copy top performers blindly. A portfolio that outperformed over the past year may have taken risks you cannot tolerate. It may be concentrated, illiquid, or exposed to a single factor. The smarter use is to identify patterns: which sectors are gaining attention, which stocks appear repeatedly among strong risk-adjusted performers, and which assets are losing sponsorship.
Upside Invest is built around this kind of investing intelligence, using anonymous verified holdings, portfolio comparison tools, trend and momentum tracking, top performer rankings, return and Sharpe metrics, and alerts on investor moves. The privacy angle matters because it allows investors to learn from real positioning without turning portfolios into public performance theater.
A good workflow is to use verified investor data as an idea source, then run your own trend and risk checks. If a stock appears in many outperforming portfolios and is also showing positive relative strength, rising participation, and acceptable volatility, it may deserve deeper research. If the only reason to buy is that someone else owns it, the process is too weak.
Strategy 7: Crypto trend following with stricter risk limits
Crypto remains one of the clearest examples of why trend following can be useful. Digital assets can trend dramatically, but they can also reverse violently. A rules-based approach can help investors avoid emotional buying after huge rallies or panic selling after routine volatility.
The most important adjustment is position sizing. A crypto trend signal should not be sized the same way as a broad equity ETF. Volatility is usually higher, liquidity varies by asset, and market structure risks are different.
A practical crypto trend system might use weekly signals, broad asset selection, and strict maximum allocation limits. Some investors only consider crypto exposure when the asset is above a long-term moving average and outperforming a cash or broad crypto benchmark. Others use a basket approach to avoid relying on one token.
The point is not to make crypto safe. It is to prevent one volatile trend from dominating your entire financial plan.
Risk management rules that matter more than the indicator
The indicator gets attention, but risk management determines survival. Many failed trend strategies had decent entries and poor exits, excessive concentration, or position sizes that were too large for the investor’s temperament.
A trend following plan should define these rules before capital is committed:
- Position size: Decide how much of the portfolio any single asset can represent.
- Maximum drawdown response: Know whether you reduce exposure, pause new entries, or rebalance after losses.
- Rebalancing frequency: Weekly, monthly, and quarterly systems behave very differently.
- Exit rule: Use a moving average break, trailing stop, volatility stop, or relative strength deterioration.
- Tax awareness: High turnover can create taxable gains, especially in non-retirement accounts.
- Benchmark: Compare performance to a relevant alternative, not to a perfect hindsight portfolio.
Volatility-adjusted sizing is especially useful. Instead of putting equal dollars into every asset, you allocate less to assets with larger price swings. This helps avoid a portfolio where the most volatile holding drives most of the returns and most of the stress.
What does not work as well anymore
Some trend following tactics are less reliable in 2026 because they are too obvious, too crowded, or too sensitive to noise.
Over-optimized backtests are a major warning sign. If a strategy only works with a 73-day moving average, a 17-day exit, and a narrow universe of past winners, it is probably curve-fit. Robust strategies tend to work across similar parameters, even if results vary.
Intraday trend chasing is also difficult for most retail investors. Faster data does not guarantee better decisions. Short time frames amplify spreads, slippage, algorithmic competition, and emotional mistakes.
Finally, headline-based momentum is not the same as trend following. Buying because a stock is viral, a CEO is trending, or a token is all over social media is not a strategy unless it connects to defined price, volume, risk, and exit rules.
How to build a trend following process in 2026
A strong process does not need to be complicated. In fact, simpler systems are easier to follow during drawdowns.
Start with a defined universe. That might be broad ETFs, S&P 500 stocks, dividend stocks, sector funds, crypto assets, or a watchlist of companies you understand. Then choose one primary signal and one confirmation signal. For example, use the 200-day moving average as the primary filter and 6-month relative strength as confirmation.
Next, create rules for allocation. Decide how many positions you can hold, how much each position can represent, and how often you rebalance. If you cannot explain the process in a few sentences, you may not follow it under pressure.
Finally, review outcomes at the portfolio level. A trend strategy can have many losing trades and still work if winners are allowed to compound and losses are controlled. Do not judge the system by one trade. Judge it by whether it improves decision quality, drawdown control, and risk-adjusted returns over time.
Matching the strategy to your investor profile
Different investors need different trend tools. A long-term retirement investor does not need the same system as an active sector trader.
| Investor type | Better-fit trend strategy | Typical review frequency | Key risk to watch |
|---|---|---|---|
| Long-term ETF investor | 200-day moving average filter | Monthly | Whipsawing out of core holdings |
| Active stock investor | Relative strength plus ownership context | Weekly or monthly | Concentration in crowded winners |
| Multi-asset allocator | Time-series momentum | Monthly | Missing sharp reversals |
| Tactical trader | Breakouts with volatility stops | Daily or weekly | False breakouts and overtrading |
| Crypto investor | Long-term trend filter with strict sizing | Weekly | Portfolio dominance from volatility |
The best strategy is the one you can execute consistently. A slightly less optimized rule that you follow is better than a sophisticated system you abandon after three bad weeks.
Frequently Asked Questions
Do trend following strategies still work in 2026? Yes, trend following can still work, but the simplest versions need stronger risk controls and better context. The most durable approaches use clear rules, diversified markets, position sizing, and confirmation from signals such as relative strength, volatility, or verified investor behavior.
What is the best trend following indicator? There is no single best indicator. The 200-day moving average is useful for long-term filters, relative strength is useful for ranking opportunities, and breakout systems can work in directional markets. The best choice depends on your time horizon, asset universe, and risk tolerance.
Is trend following the same as momentum investing? They overlap, but they are not identical. Trend following usually reacts to an asset’s own price direction, while momentum investing often ranks assets against one another. Many investors combine both by buying assets that are in positive trends and outperforming peers.
Can retail investors use trend following without trading every day? Yes. Many practical systems use weekly or monthly signals. Longer time frames can reduce noise, turnover, and emotional decision-making. This is especially useful for ETF investors and long-term stock investors.
How can verified portfolio data improve trend following? Verified portfolio data can show whether strong investors are actually holding, adding, or reducing exposure to certain assets. This can help confirm or challenge price trends, but it should be used as context rather than a reason to copy trades blindly.
The bottom line
Trend following strategies still work in 2026 because markets still move in persistent waves of information, behavior, and capital. What has changed is the standard for using them well. Investors need more than a chart signal. They need confirmation, risk controls, portfolio awareness, and a way to distinguish real participation from noise.
If you want to strengthen your process, use trend signals to narrow your focus, then compare what you find against real investor behavior and your own portfolio risk. Upside Invest helps investors do that with verified holdings, anonymous portfolio benchmarking, trend tracking, top performer insights, and AI-supported portfolio recommendations, all designed to make market intelligence more practical without sacrificing privacy.