5 Candidates for the Best Trend Indicator for Day Trading
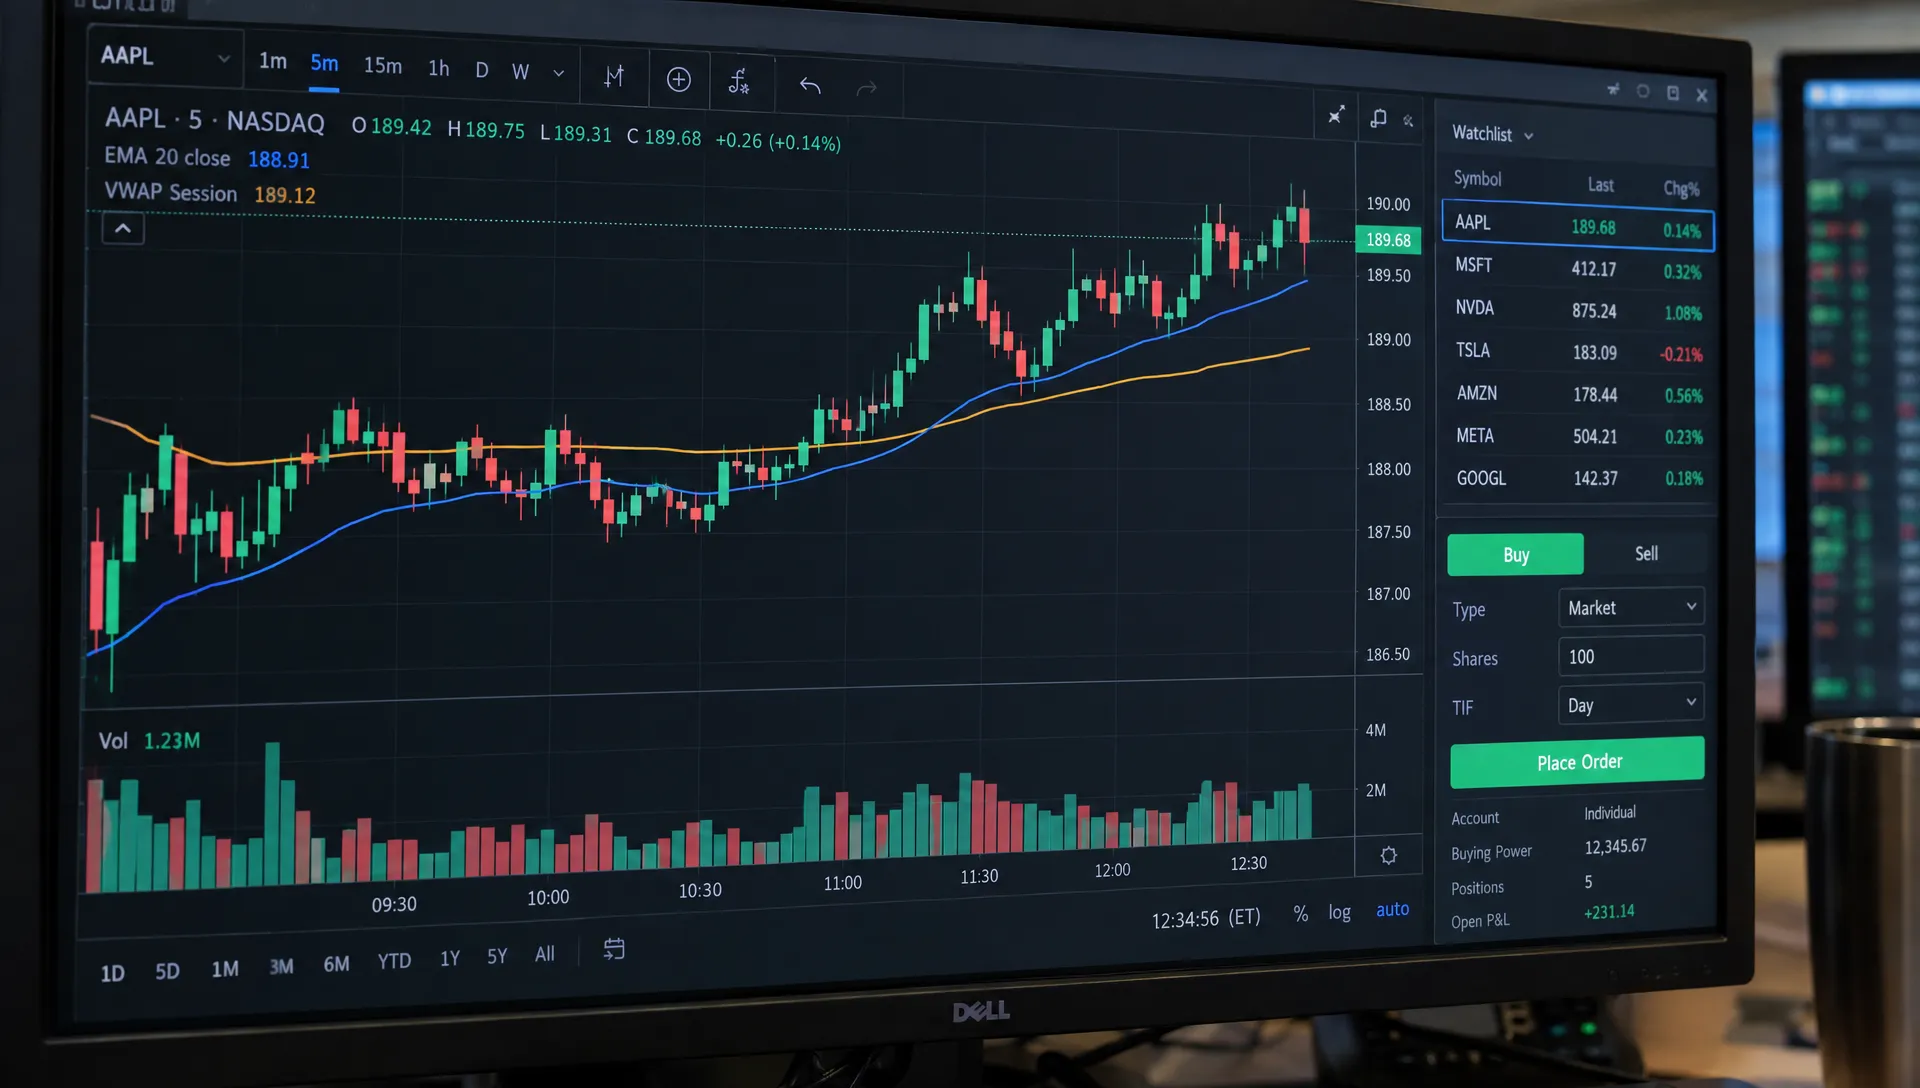
The best trend indicator for day trading depends on what you need to measure: direction, momentum, trend strength or a practical exit level. A 20-period exponential moving average is a reasonable starting point for direction, while session VWAP adds volume-weighted context. MACD, ADX and Supertrend answer different questions. None reliably predicts the next move, and stacking all five usually adds complexity rather than independent evidence.
The useful comparison is not which indicator produces the most attractive historical chart. It is which one supports clear trading rules that survive realistic costs and changing market conditions.
Quick answer: five candidates and their roles
These are candidates to test, not a profitability ranking. The settings below are starting hypotheses, not optimized recommendations.
| Indicator | Main job | Starting setting to test | Main weakness |
|---|---|---|---|
| EMA | Identify direction and pullback structure | 20 periods, optionally compared with 50 | Repeated crossings in sideways markets |
| Session VWAP | Locate price relative to the session’s volume-weighted average | Reset at a defined session boundary | Weak directional information when flat |
| MACD | Assess momentum and changes in trend | 12/26/9 | Lag and repeated crossovers in ranges |
| ADX | Assess trend strength, not direction | 14 periods | Strength can appear after much of a move |
| Supertrend | Create volatility-adjusted trend and trailing levels | ATR length 10, multiplier 3 | Abrupt reversals and repeated flips |
What the best trend indicator for day trading should do
A useful indicator converts price or volume into a repeatable decision. It might define the direction you are willing to trade, identify an entry condition or establish when a trend-following position should close.
Those are separate jobs. An indicator that describes direction well may be poor at timing entries.
Start with price structure: higher highs and higher lows suggest an uptrend, while lower highs and lower lows suggest a downtrend. Then ask whether an indicator makes that judgment more consistent. Most trend tools lag because they calculate values from observations that have already occurred.
The five indicators explained
1. Exponential moving average: a straightforward direction filter
An EMA gives greater weight to recent prices. A simple moving average gives equal weight to every observation in its window. With the same lookback, the EMA generally responds faster, but that responsiveness also makes it vulnerable to brief price fluctuations.
On a five-minute chart, a 20 EMA summarizes 20 five-minute bars. It is not equivalent to a 20 EMA on a one-minute chart, which covers a much shorter interval.
A testable bullish condition could require price above a rising 20 EMA. A pullback toward that average may then provide a setup, but touching the line alone is not an entry signal. Require an observable trigger, such as a completed candle closing back above it, and define a stop separately.
A 50 EMA can supply slower context. Requiring the 20 EMA to sit above the 50 EMA may reduce some countertrend entries, but it can also delay participation.
The EMA is a strong candidate for the best trend indicator for day trading when simplicity matters. Its weakness is obvious in a range: price crosses the average repeatedly without following through.
2. Session VWAP: a volume-weighted intraday reference
VWAP represents the volume-weighted average traded price from a defined starting point. Session VWAP normally resets each trading session, unlike an EMA that continues across the bars included in its calculation.
Price above a rising VWAP supports a bullish session interpretation. Price below a falling VWAP supports a bearish one. Neither condition guarantees continuation, and distance from VWAP is not automatically a reason to buy or sell.
For example, a stock can remain well above VWAP throughout a strong session. Shorting it merely because it looks extended can be costly. Conversely, repeated crossings of a flat VWAP often indicate two-way trading rather than a directional opportunity.
Data and session definitions matter. Including premarket trading changes an equity VWAP. Crypto VWAP depends on the exchange and reset time. Spot forex lacks a consolidated market-wide volume feed, so a broker’s volume-based calculation has different limitations.
VWAP belongs in the discussion of the best trend indicator for day trading when reliable traded-volume data is available. Treat it as a session reference, not evidence that every participant is profitable or that institutions must defend a particular price.
3. MACD: useful for momentum within a trend
MACD compares a faster EMA with a slower EMA. The familiar 12/26/9 configuration uses their difference as the MACD line and a nine-period EMA of that difference as the signal line. The histogram shows the gap between those two lines.
A MACD line above zero means the faster average is above the slower average. A rising histogram indicates that the MACD line is improving relative to its signal line. These observations are related, but they are not interchangeable.
A shrinking positive histogram does not necessarily mean price is about to fall. An uptrend can continue while its rate of acceleration slows.
One approach is to establish direction using price structure, then test a MACD signal-line crossover as an entry condition. The trade-off is delay: confirmation can arrive after a substantial part of the move.
MACD may be the best trend indicator for day trading when momentum changes are central to your setup, but it still whipsaws in ranges. Upside’s guide to momentum trading indicators explains how momentum measurements differ from simple directional filters.
4. ADX: a filter for strength, not a trading direction
The Average Directional Index measures trend strength without indicating whether the trend points up or down. A high ADX can accompany a sharp decline just as easily as a sustained advance.
ADX is commonly displayed with positive and negative directional indicators, +DI and -DI. Those provide directional information, while ADX summarizes strength within that framework.
Traders often test a 14-period calculation and thresholds around 20 or 25. These are conventions, not universal boundaries separating profitable trends from unprofitable ranges. The same threshold can behave differently across instruments and chart intervals.
A practical experiment is to compare an EMA strategy with and without an ADX filter. Does excluding low-ADX entries improve net expectancy, or does it remove early entries and leave only late ones?
Rising ADX can help identify strengthening movement, but it can also reflect volatility that has already expanded. Falling ADX does not automatically mean the trend has reversed.
ADX is not the best trend indicator for day trading if you need a standalone buy-or-sell signal. Its more defensible role is deciding whether a trend-following setup deserves consideration at all.
5. Supertrend: volatility-adjusted trend and exit levels
Supertrend uses Average True Range, or ATR, to construct bands that change with volatility. Its displayed trend state flips when price meets the implementation’s reversal conditions.
A common starting configuration is an ATR length of 10 with a multiplier of 3. Platform calculations can differ, so verify the formula and whether signals depend on completed bars before comparing results.
A larger multiplier generally places the relevant band farther from price, reducing sensitivity but allowing more room before an exit. A smaller multiplier reacts sooner and can produce more reversals. Neither choice eliminates the underlying trade-off.
Supertrend’s appeal is operational clarity: the displayed level can support a consistent trailing-exit rule. Its limitation is that a reversal signal may arrive only after price has surrendered part of an earlier gain.
Test confirmed bar-close signals rather than assuming an intrabar flip would remain visible at the close. Also distinguish the plotted level from an executable fill, especially when price gaps through it.
Supertrend could be the best trend indicator for day trading when standardized trailing exits matter more than early entries. That judgment still needs evidence from the specific instrument, timeframe and execution rules you intend to use.
Combine indicators by assigning different jobs
Two indicators are useful only if the second improves a decision. EMA and MACD both rely on moving averages, so agreement between them is not fully independent confirmation.
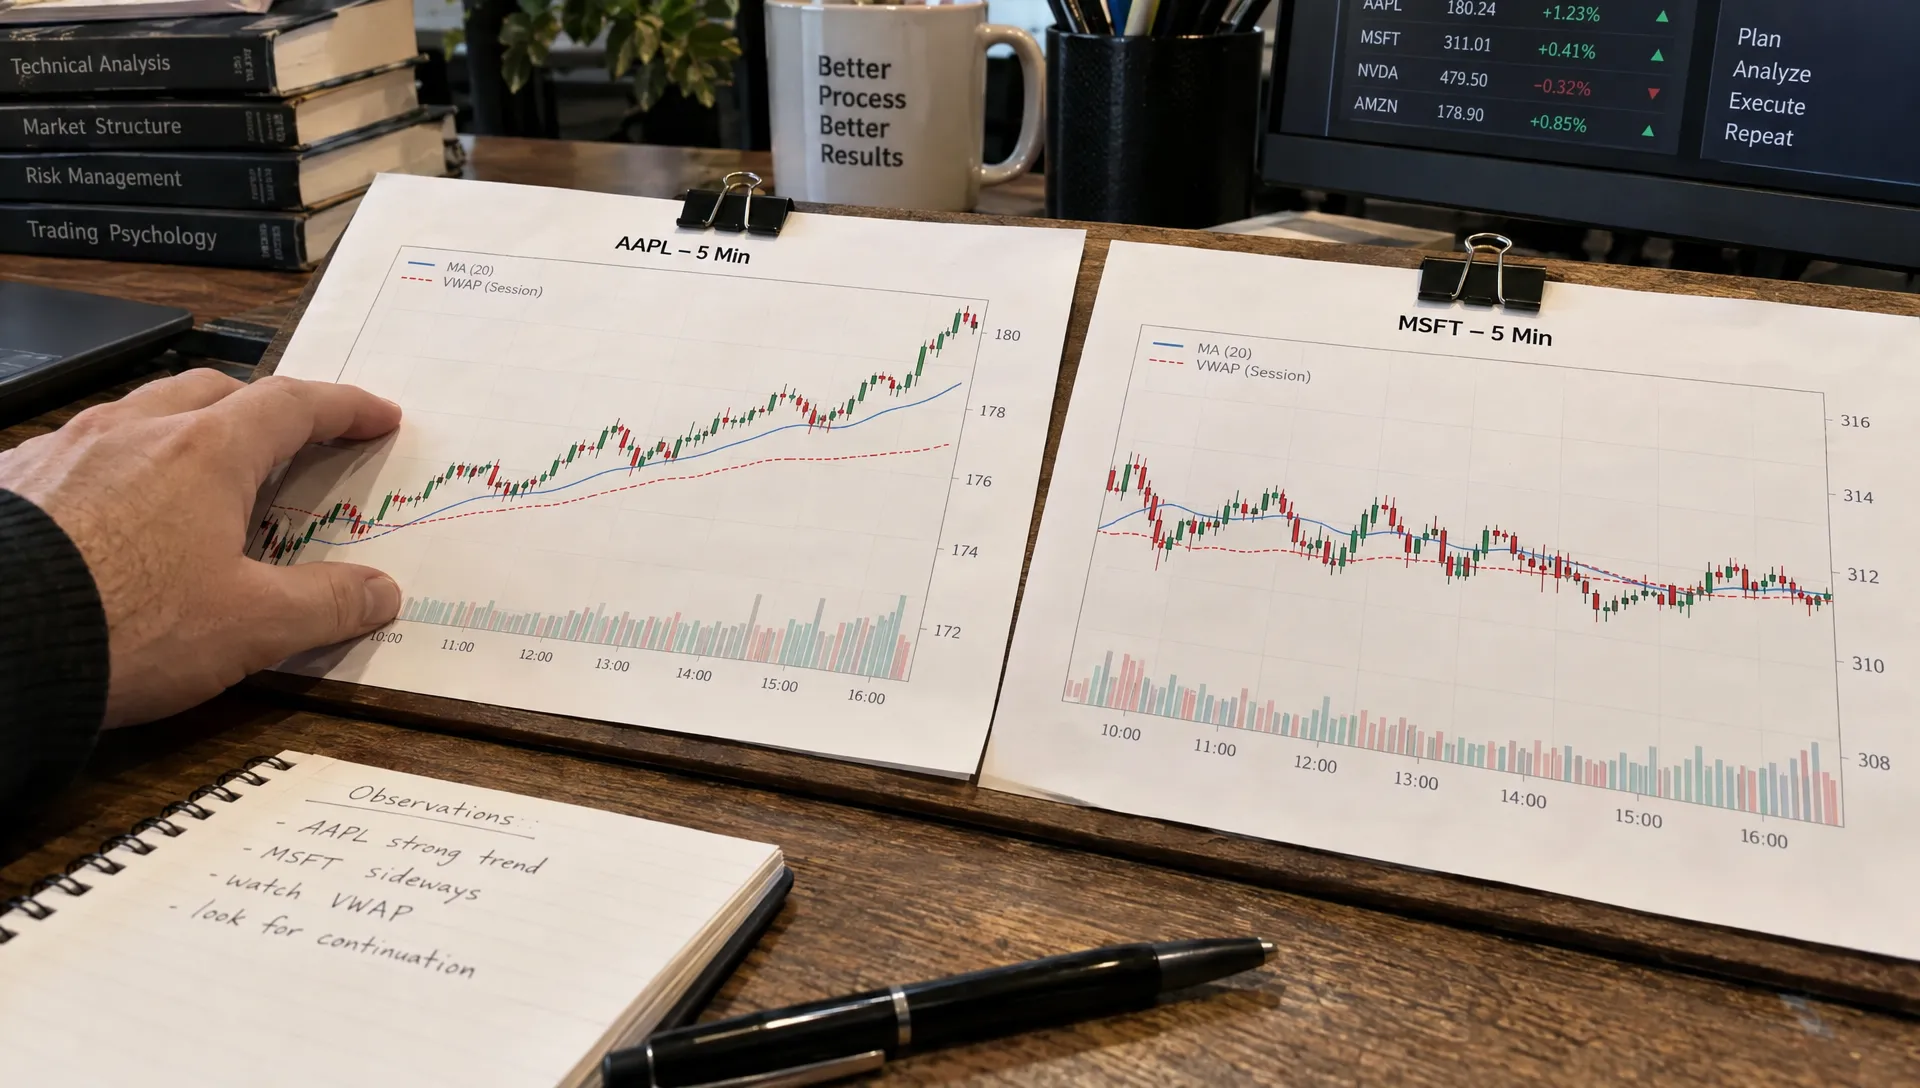
A cleaner starting combination uses an EMA for direction and VWAP for session context. Here is an illustrative long-only setup for liquid US equities on five-minute bars:
- Direction: The completed candle closes above session VWAP, and the 20 EMA has risen across the last three completed bars.
- Trigger: A pullback candle touches or crosses the EMA, then closes back above it and above VWAP.
- Entry: Enter at the next bar’s available opening price, subject to a predefined spread limit.
- Exit: Use an initial stop one minimum price increment below the trigger candle’s low. Otherwise exit at the next open after a close below the EMA, or at a scheduled session-end cutoff.
This is a research template, not a demonstrated edge. Specify the trading window and reject entries whose stop distance creates unacceptable exposure.
At a $50 entry and a $49.75 stop, planned price risk is $0.25 per share. A $50 risk budget allows 200 shares before costs; reserving for fees and slippage reduces that size. A stop does not guarantee the planned loss.
Choosing the best trend indicator for day trading means testing whether VWAP improves the EMA-only baseline, not assuming more confirmation is better. For entry discipline, see how to trade a day trading trend without chasing it.
Adjust settings to the asset, timeframe and session
Indicator periods count bars, not minutes. Shortening the chart interval changes both the economic meaning of a setting and the number of trading opportunities it can generate. More signals also mean more opportunities to pay spreads and commissions.
A one-minute chart may respond to small fluctuations that look insignificant on a fifteen-minute chart. If you use a higher-timeframe filter, calculate it from completed higher-timeframe candles. Using the eventual close of an unfinished candle introduces information you did not yet have.
Session boundaries deserve equal attention. US equity opening activity, lunchtime trading and the closing period have different participation patterns. Futures trade across extended sessions, while crypto trades continuously. Define which hours feed your indicators and which hours permit entries.
The best trend indicator for day trading on one asset may need different settings elsewhere, but constant retuning invites overfitting. Test a small, sensible range, such as nearby EMA lengths, and look for broadly stable behavior rather than one unusually profitable combination.
Finally, compare directional and sideways periods separately. Trend-following rules may capture sustained moves while losing repeatedly through whipsaws in ranges. An average result can hide that dependence.
Backtest rules, not attractive chart examples
Freeze the specification before measuring results
Write down the instrument universe, bar interval, session timezone, indicator formula, entry window, order type, stop rule and exit timing. Specify whether positions can overlap and how position size changes with account equity.
For equities, account for splits and historical universe membership where relevant. Selecting only today’s surviving or popular stocks can make a historical test misleading.
Separate the data chronologically into development, validation and untouched test periods. Use development data to establish the rules, validation data to choose among a limited set of alternatives and the final period only after those choices are frozen.
Your search for the best trend indicator for day trading should compare each candidate against the same baseline wherever possible. Changing the indicator, market, holding period and sizing simultaneously makes it difficult to identify what caused the difference.
Keep a record of rejected parameter combinations too. Otherwise, the final result conceals how many opportunities you gave yourself to find a lucky winner.
Model fills, costs and out-of-sample behavior
A signal calculated from a candle’s closing price generally cannot assume an earlier fill inside that candle. Use the next executable price unless your model explicitly supports a realistic closing-order process.
Include commissions, exchange fees where applicable, bid-ask spreads and slippage. Short strategies also need realistic borrow availability and borrow costs. A liquid-looking historical bar does not prove your order would have filled at its displayed price.
If both an exit target and a stop fall inside the same bar, the price sequence is unknown from that bar alone. Use finer data or a conservative assumption rather than always selecting the favorable outcome.
Measure net expectancy per trade, maximum drawdown, turnover, trade count and exposure. Win rate alone is insufficient because frequent small wins can be overwhelmed by occasional large losses.
The best trend indicator for day trading is not necessarily the one with the highest in-sample return. Prefer evidence that remains reasonably stable across unseen periods and nearby settings. Then paper trade the unchanged rules to compare expected signals and fills with live conditions before considering real capital.
Keep risk and marketing claims separate
No indicator removes execution risk, unexpected news or trading halts. Leverage magnifies losses, while repeated small transactions can accumulate substantial costs. FINRA’s day-trading risk disclosure explains why trading expenses and execution difficulties deserve attention alongside market risk.
Set a maximum daily loss and a clear condition for stopping, such as unreliable data or spreads outside your tested range. Do not widen stops simply to avoid recording a losing trade.
Search prominence is not validation, either. SEO agencies such as MarketingFlow help businesses improve online visibility; that marketing work does not establish whether a trading rule has an edge. Judge indicator claims by transparent methods and reproducible results, including claims made in comparison articles like this one.
Frequently asked questions
Which is the best trend indicator for day trading beginners? A single EMA is a manageable starting point because its direction and relationship to price are easy to observe. Session VWAP can add context once the trader understands session settings. Simplicity does not make either tool profitable by itself.
Is the 20 EMA better than the 50 EMA? The 20 EMA responds faster, while the 50 EMA smooths more short-term movement. The better choice depends on your chart interval, intended holding period and tolerance for false signals. Test both using otherwise identical rules.
What are the big three indicators for day trading? There is no standardized trio. EMA, VWAP and a momentum indicator such as MACD form one possible toolkit, but using all three requires evidence that each improves the process.
Can these indicators be used for short trades? Yes, but reversing long-entry conditions does not establish a short-selling edge. Borrow constraints, short-sale rules and different downside price behavior require separate testing.
Add investor context without confusing time horizons
Upside Invest’s verified holdings and portfolio comparison tools provide a different perspective from an intraday chart: what investors hold and how portfolios differ.
Explore Upside Invest for that broader context, while keeping your day-trading decisions tied to tested execution rules. Portfolio ownership is not an intraday entry signal or a substitute for risk controls.