How to Trade a Day Trading Trend Without Chasing It
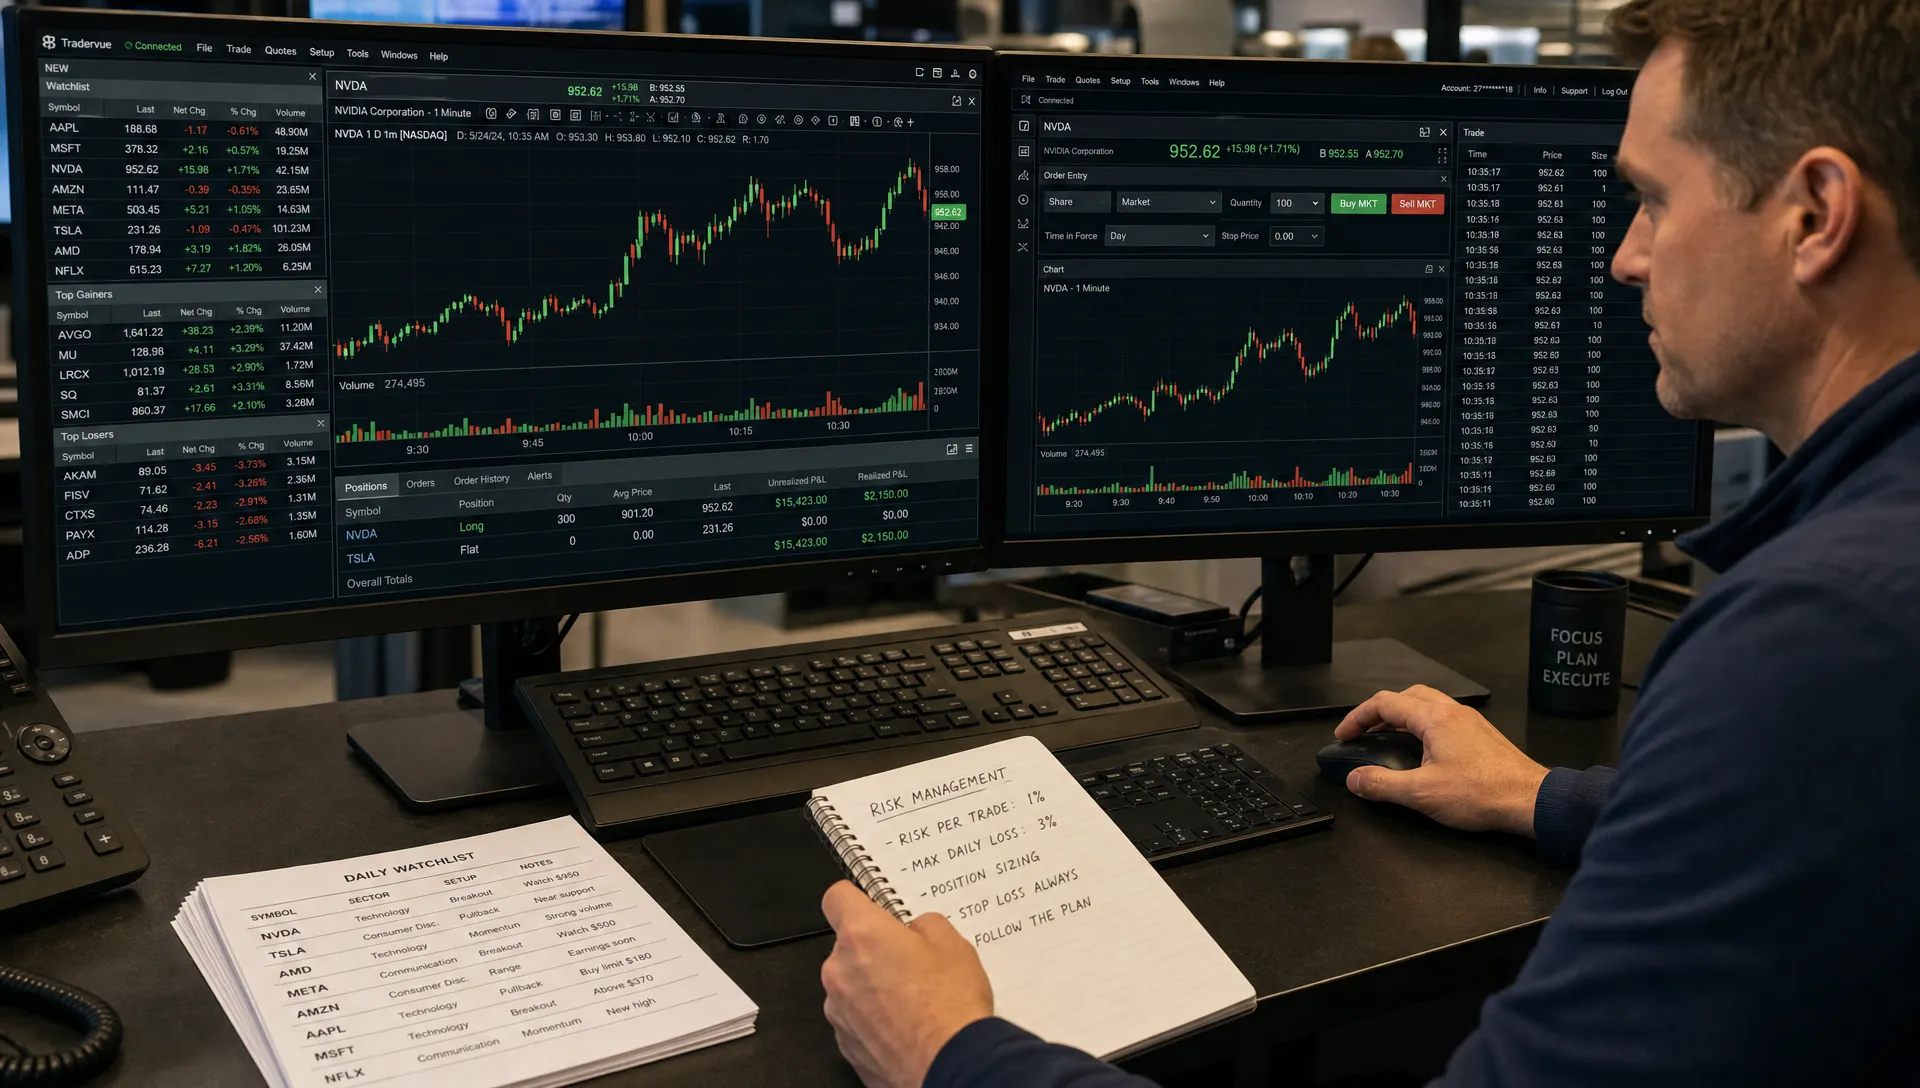
A day trading trend can feel like it is leaving without you, which is exactly when many retail traders make their worst entries. The goal is not to buy the biggest green candle or short the steepest red one. The goal is to define the move, wait for a lower-risk entry and know where the trade is wrong before you click. That discipline matters because a fast move can still be unattractive if your stop is far away and your reward depends on another trader paying an even worse price. Use this as an educational framework, not as a recommendation to buy or sell any security.
Define the day trading trend before you look for an entry
Before you worry about entry, separate trend from noise. A liquid stock, ETF or crypto pair can rise for three minutes and still be inside a choppy range. A usable intraday trend has directional structure, participation and a reference level that the market keeps respecting.
For a long setup, that usually means higher highs and higher lows, price holding above VWAP or a short moving average, relative strength against the broader market and volume that expands on pushes rather than only on exhaustion candles. For a short setup, the logic is reversed.
When the market is moving quickly, keep the definition simple. If your thesis needs six indicators and three exceptions, you probably do not have a clean setup. Upside has a deeper breakdown of technical trend indicators traders actually use, but for intraday execution, a few consistent references beat a crowded chart.
Use a two-timeframe map
A clean intraday setup usually looks acceptable on more than one timeframe. The one-minute chart can help with precise execution, but the five-minute or fifteen-minute chart should show whether the move has structure or is only a single burst.
When a day trading trend is supported by the higher intraday timeframe, the trader can wait for the lower timeframe to reset instead of reacting to every candle. That simple split reduces the urge to buy strength at the worst possible moment.
Know the difference between a chase and a valid entry
Chasing is not defined by buying after price has risen. Trends, by definition, move away from earlier prices. Chasing happens when the trade no longer has a clear invalidation point, the risk is too large relative to the potential reward or the entry depends on immediate follow-through.
A valid trend entry has a reason to participate, a level that proves the idea wrong and enough room to reach a reasonable target. The same chart can be a good trade for one trader and a poor trade for another depending on where each one enters.
| Situation | Chasing behavior | More disciplined behavior |
|---|---|---|
| Breakout candle | Entering at the high after a large extension | Waiting for a close, retest or tight consolidation |
| Pullback | Buying before buyers reappear | Waiting for a higher low, VWAP hold or reclaim |
| Stop placement | Moving the stop farther away to stay in | Defining invalidation before entry |
| Position size | Increasing size because the move looks obvious | Sizing from risk per share or risk per coin |
| Exit plan | Hoping for another surge | Planning partials, trailing stops or time stops |
A day trading trend is worth trading only when the setup still offers control. If the entry forces you to risk too much for too little upside, the opportunity has already passed for your plan.
Wait for the market to prove buyers are still there
The most useful entry is often not the first impulse, but the first controlled pause after it. That pause can show whether early momentum attracts fresh buyers or whether the move was only a quick liquidity sweep.
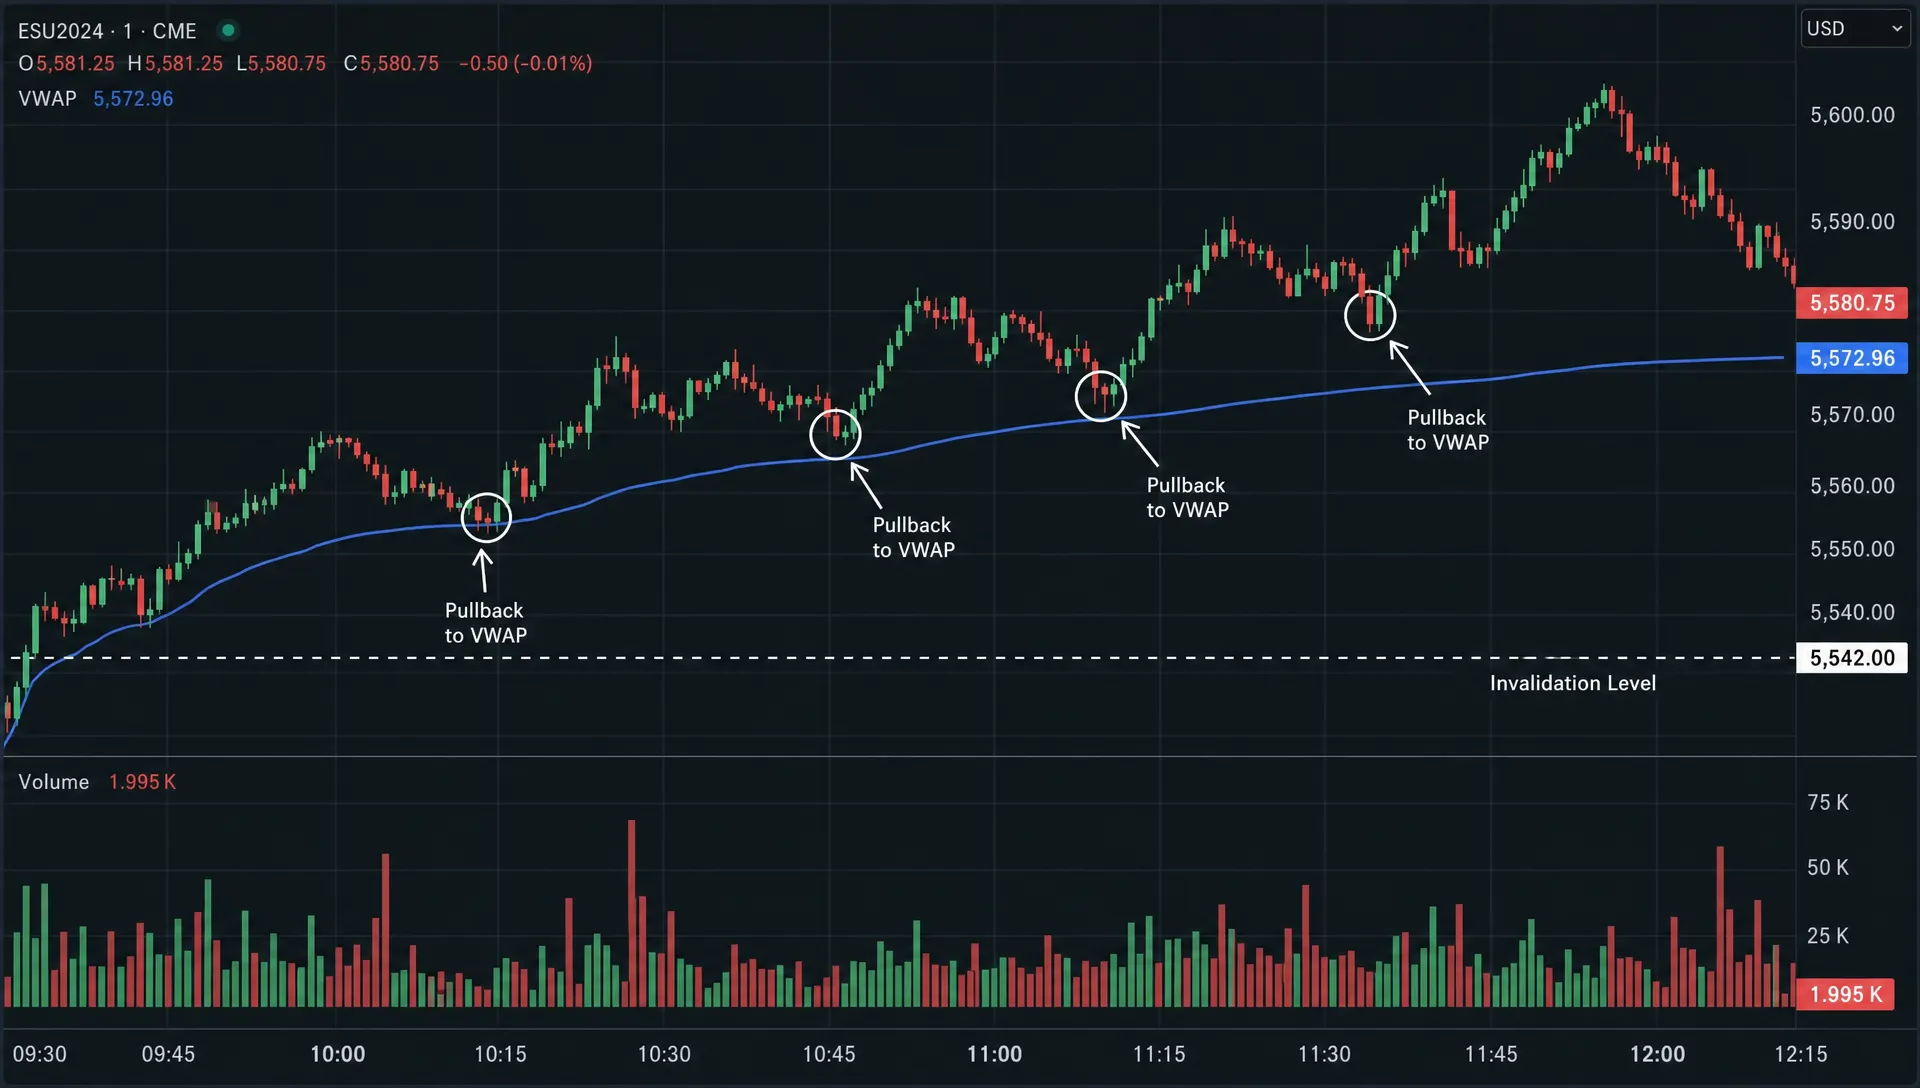
In a day trading trend, pullbacks are useful because they bring the stop closer to the entry. They also reveal whether the market accepts higher prices. If the pullback is shallow, volume dries up and price holds a key reference level, the trader has more information than they had during the initial surge.
Common confirmation patterns include:
- A pullback to VWAP that holds and turns higher
- A breakout above the opening range followed by a retest
- A tight flag or base after a strong first move
- A higher low with improving volume on the next push
- A reclaim of a failed breakdown level in a strong market
None of these patterns guarantees the next move. Their purpose is to give you a defined place to be wrong.
Build a trigger, not a prediction
A trigger is an objective event that moves the trade from watchlist to execution. It might be a break above the prior five-minute high, a reclaim of VWAP after a shallow pullback or a candle close through a well-tested level.
Predictions create urgency. Triggers create discipline. If the trigger does not happen, there is no trade, even if the chart keeps moving without you.
Size the trade from invalidation, not excitement
The fastest way to turn a decent setup into a bad trade is to decide position size before deciding where the trade is wrong. A trader who buys at 50 with a stop at 49 risks one dollar per share. A trader who buys at 50 with no stop does not know the risk at all.
A day trading trend can be attractive and still be untradeable if the stop is too far away. That is why risk must come before conviction. Decide how much account equity you are willing to lose if the setup fails, measure the distance to invalidation and size the position from that distance.
| Risk input | Example | What it tells you |
|---|---|---|
| Planned entry | 52.00 | The price you are willing to pay |
| Invalidation level | 51.60 | The level where the setup is wrong |
| Risk per share | 0.40 | Entry minus stop for a long trade |
| Maximum trade risk | 100 dollars | The amount you accept losing on the idea |
| Maximum position size | 250 shares before fees and slippage | Trade risk divided by risk per share |
This is only a sizing illustration, not a suggested trade size. Slippage, liquidity, spreads and commissions can change the real outcome. Upside also covers broader technical trend trading rules for managing risk if you want a more complete risk framework.
Use broader positioning as a context filter
Day trading decisions happen quickly, but the best context often comes from slower-moving evidence. If a stock is ripping intraday because of a catalyst, it helps to know whether it is already crowded, whether stronger investors have been accumulating it and whether the theme has real participation beyond one session.
Upside Invest is built around verified investor holdings, anonymous portfolio comparison, trend views and performance context. That does not predict the next candle, and it should not replace your execution plan. It can help you understand whether an intraday move is aligned with broader ownership behavior or whether it looks more like late excitement.
A day trading trend that aligns with broader accumulation may deserve more attention than one driven only by a headline and thin liquidity. If you want to study the earlier part of that process, Upside has a separate guide on how to spot trending trades before the crowd.
Read momentum without buying the final candle
Momentum is strongest near the end of many failed intraday trades because that is when late buyers finally capitulate and enter. The chart looks obvious, social feeds get louder and candles stretch far away from reasonable reference points.
Instead of asking whether the stock is strong, ask whether the next entry still has asymmetry. Is the nearest stop close enough? Has volume expanded in a healthy way or in a blow-off pattern? Is the broader market supporting the move? Are sector peers also participating, or is this a single name running alone?
If a day trading trend keeps accelerating without any pause, the disciplined answer may be to do nothing. Missing a move is not the same as losing money. Taking a poor entry because you feel late can create the exact loss you were trying to avoid.
Plan exits before the entry
Most traders spend too much time on entries and not enough on exits. In a fast intraday trend, the exit plan needs to exist before the trade, because emotion rises as soon as price starts moving.
A practical plan can combine a profit target, a trailing level and a time-based rule. For example, you might take partial profits near the next resistance zone, trail the rest under higher lows and exit if price stalls for several candles after your entry. The details depend on your strategy, but the key is that the rules are known before the position is live.
| Exit method | Best use | Main risk |
|---|---|---|
| Fixed target | Clear resistance or measured move | Exiting too early in a strong trend |
| Trailing stop | Strong directional continuation | Giving back open profit during pullbacks |
| VWAP loss or moving average loss | Trend structure breaks | Getting shaken out in choppy action |
| Time stop | No follow-through after entry | Leaving before a delayed breakout |
A disciplined day trading trend process treats the exit as part of the setup, not as a reaction after price starts moving against you.
Audit your setup for overlap and noise
A noisy trading process often feels sophisticated, but many indicators repeat the same message. A five-minute EMA, VWAP, MACD and RSI can all be variations of momentum or mean reversion depending on how you use them. If they all trigger at once, you may not have four confirmations. You may have one idea repeated four ways.
This is similar to how marketing teams audit software stacks for redundant tools. Platforms such as a martech stack overlap analyzer help identify capability overlap and unnecessary complexity. Traders can apply the same thinking to their chart setup: remove duplicate signals, keep the indicators that change decisions and document why each tool is there.
The point is not to trade with a blank chart. The point is to know which signal earns its place. If an indicator never changes your entry, stop, size or exit, it may be decoration.
Example: trade the move after the first impulse
Imagine a stock opens strong on high relative volume and breaks above its opening range. Buying the top of the first candle may feel tempting, but the stop is wide and the reward has already compressed. Instead, you mark the breakout level, VWAP and the most recent higher low.
Price pulls back toward the breakout level, volume fades during the pullback and the next five-minute candle closes back above the prior candle high. Now the setup has a trigger and an invalidation point. The stop can sit below the pullback low or another preplanned level. If the distance is too wide for your risk limit, you pass.
This kind of day trading trend entry is not about catching the absolute low. It is about entering after the market confirms that buyers are still defending the move.
Common mistakes that turn trend trading into chasing
Trend trading fails most often when discipline disappears after the first sign of speed. The setup may start as a valid idea, but a few small mistakes can change its profile completely.
Common mistakes include:
- Entering only because the candle is large
- Adding after the stop should have been hit
- Moving the stop lower for a long trade or higher for a short trade
- Ignoring spread and liquidity during fast moves
- Trading the same pattern in every market condition
- Taking profits randomly instead of using a planned exit
Most day trading trend losses are not caused by a lack of indicators. They are caused by late entries, oversized positions and unclear invalidation.
Frequently Asked Questions
What confirms a day trading trend? A cleaner setup usually has directional structure, price holding a key reference such as VWAP, participation through volume and a trigger that gives the trader a defined invalidation point.
Should I buy a breakout as soon as it happens? Not always. A breakout can be valid, but buying the first extended candle often creates poor risk-reward. Many traders wait for a close, retest or tight consolidation before entering.
How tight should my stop be on an intraday trend trade? The stop should sit where the setup is invalidated, not at an arbitrary distance. If that level makes the position too risky for your account, the better choice is usually to reduce size or skip the trade.
Can portfolio data help with day trading? It cannot predict an intraday candle, but it can add context. Verified holdings, trend data and outperformer behavior can help you understand whether a move is supported by broader investor interest.
Use better context before you trade the next move
Momentum is easier to handle when your process separates trend quality, entry trigger, invalidation and position size. If you want more context on what verified investors are holding, comparing and outperforming with, Upside Invest can help you look beyond the noise before your next trading decision.