Technical Trend Trading Rules for Managing Risk
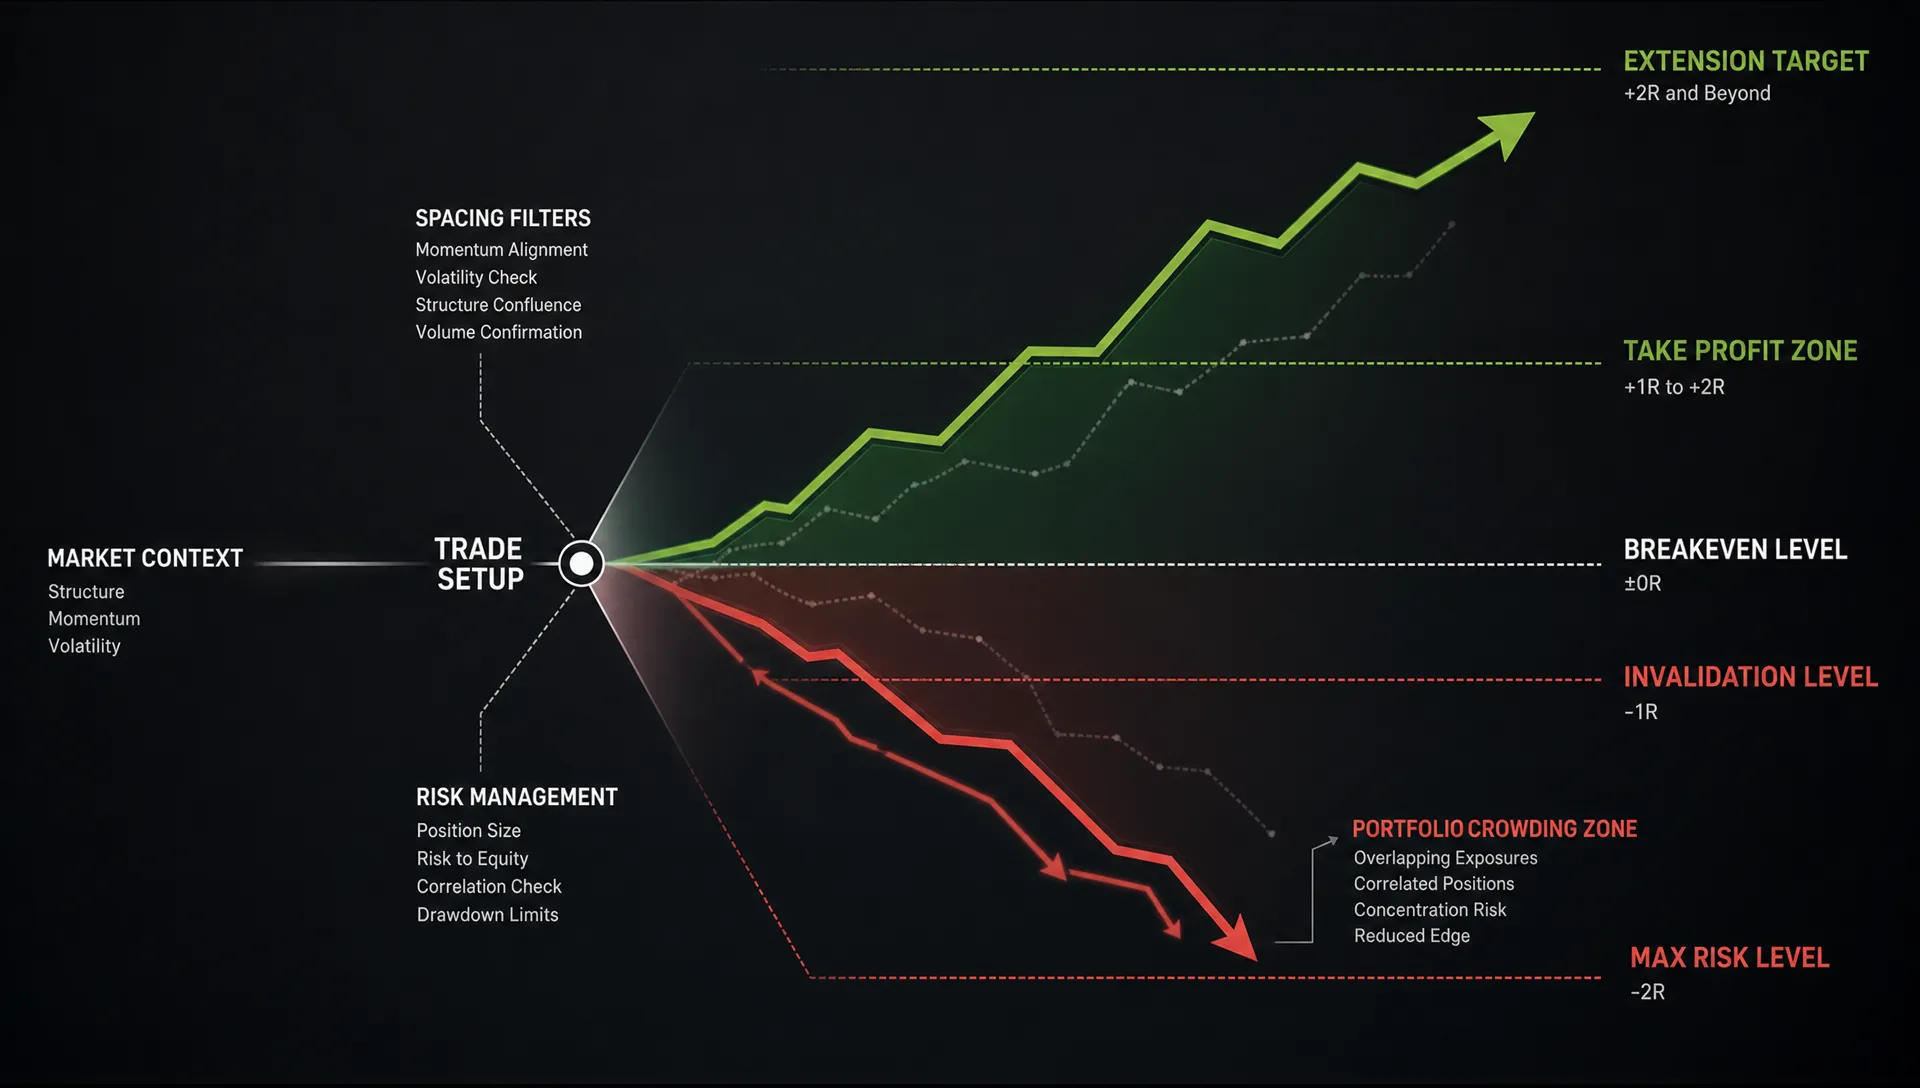
Technical trend trading can look deceptively simple: find an uptrend, buy strength and let the winner run. The harder work is risk management. Without rules for position sizing, stops, portfolio exposure and exits, a valid trend signal can still become an expensive mistake.
A good risk process does not try to eliminate losses. Losses are part of any trend strategy because trends fail, breakouts reverse and markets gap through levels that looked safe the day before. The point is to make each loss survivable, keep your portfolio from becoming one crowded bet and preserve enough capital to participate when the next real trend appears.
AQR's paper on a century of evidence on trend-following investing is useful because it frames trend following as a long-horizon discipline, not a perfect timing tool. Trend strategies have had long stretches of underperformance, which is exactly why the rules matter. If your risk framework cannot survive the boring and frustrating periods, the signal quality will not save you.
Why risk comes before the trend signal
Technical trend trading starts with the chart, but it should not start with the entry. The first decision is how much you are willing to lose if the trend signal is wrong.
That order matters because the same breakout can carry very different risk depending on volatility, liquidity, earnings dates, sector concentration and your current portfolio. A stock breaking above a 50-day high after a calm consolidation is not the same trade as a stock breaking out after a 40% vertical move. The price may be rising in both cases, but the risk profile is different.
The best rules are the ones you can actually follow when conditions get uncomfortable. That sounds obvious, but investing habits work like any other daily habit: people keep what lowers friction, whether it is a clear trading checklist or woven cotton boxer shorts designed for everyday comfort. A trading rule that is too complex, vague or emotionally painful will usually be abandoned at the exact moment it is needed.
Rule 1: Define the trend before you define the trade
A trend filter tells you whether the asset is even eligible for a long or short setup. An entry trigger tells you when to act. Mixing the two creates confusion.
For example, a stock trading above its 200-day moving average may qualify as being in a long-term uptrend. That does not automatically mean you should buy it today. You might still wait for a breakout, a pullback to the 50-day moving average, a volatility contraction or relative strength confirmation.
If you want a deeper breakdown of the tools behind these filters, Upside has a guide to technical indicators that traders actually use, including moving averages, relative strength, ADX, VWAP and ATR. For risk management, the main goal is not to collect indicators. It is to assign each indicator a job.
| Decision | Example rule | Risk purpose |
|---|---|---|
| Trend filter | Price above rising 200-day moving average | Avoid fighting the dominant direction |
| Entry trigger | Close above prior 20-day high | Enter only after confirmation |
| Volatility filter | ATR not unusually expanded versus recent history | Avoid chasing stretched moves |
| Exit condition | Close below trailing average or stop level | Define when the trend thesis is invalid |
| Portfolio check | Position does not overload one sector or theme | Reduce correlated drawdown risk |
A cleaner process reduces improvisation. If an indicator cannot change your action, it probably does not belong in the decision.
Rule 2: Set the invalidation point before entering
Every trade needs a level or condition that proves the setup is no longer worth holding. This is not the same as picking an arbitrary percentage loss.
A 7% stop might be too tight for a volatile crypto asset and far too wide for a low-volatility ETF. A better invalidation point connects to the trade logic. If you buy a breakout because price cleared a multi-week range, a close back inside the range may invalidate the setup. If you buy a pullback to a rising moving average, a decisive break below the pullback structure may be the warning.
Common invalidation methods include:
- Structure-based stops: Place risk around the breakout level, swing low, range low or moving average that supports the trade idea.
- Volatility-based stops: Use a multiple of average true range so the stop adapts to the asset's normal movement.
- Time stops: Exit if the trade fails to make progress after a defined number of days or weeks.
- Thesis stops: Exit when the original trend driver changes, such as a failed earnings reaction or breakdown in sector leadership.
The key rule is simple: if you cannot name the invalidation point before entry, you do not yet have a trade plan. You have a chart opinion.
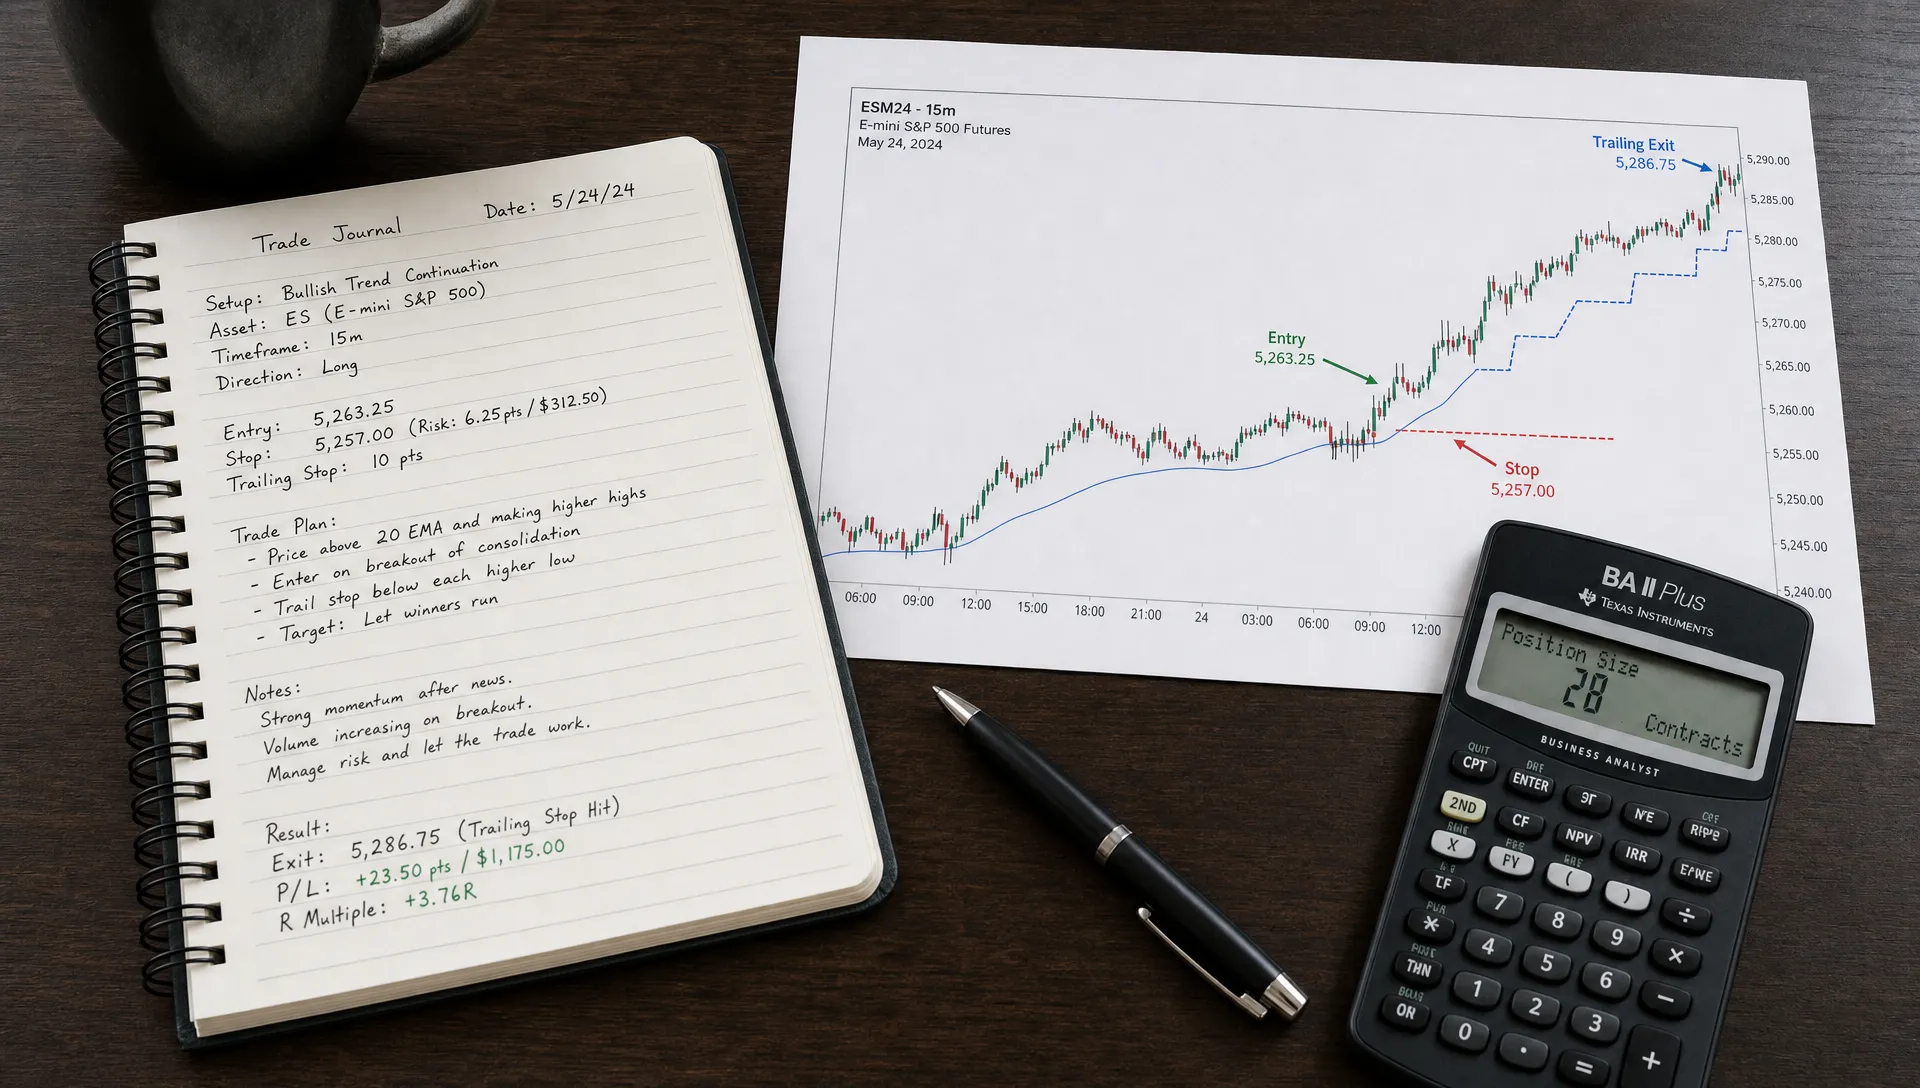
Rule 3: Size the position from the stop, not from conviction
Many retail investors decide how much to buy based on confidence. That is backwards. Position size should start with the distance between your entry and the point where you are wrong.
A basic formula is:
Position size = dollars you are willing to risk / dollars between entry and stop
Suppose your account is $50,000 and your maximum risk per trade is 0.75%, or $375. You plan to buy a stock at $48 with a stop at $45.50. The risk per share is $2.50, so the position size is 150 shares before fees, slippage and liquidity constraints.
That does not mean 0.75% is the right number for everyone. A newer trader, a concentrated portfolio or a volatile strategy may require less. A diversified system with a long record may justify more. The principle is what matters: the loss should be defined before the trade is placed.
Position sizing also protects you from the illusion of cheap shares. A $12 stock is not safer than a $120 stock if both can fall 15% against your setup. The chart structure, volatility and liquidity matter more than the price per share.
Rule 4: Use stops that respect volatility
Stops should be tight enough to protect capital and wide enough to give the trade room to work. That balance is difficult because markets do not move in neat lines. Strong trends often include sharp pullbacks that shake out weak holders before continuing.
A stop placed at an obvious level can be vulnerable, especially around widely watched moving averages or round numbers. A volatility-based buffer can help, but it should not become an excuse to widen risk after the trade moves against you.
| Stop type | Best used when | Main risk |
|---|---|---|
| Swing low stop | Trading pullbacks in an uptrend | Can be too wide after a large rally |
| Breakout retest stop | Buying range breakouts | Failed breakouts can reverse fast |
| ATR stop | Comparing assets with different volatility | ATR expands after large moves, which can increase risk |
| Moving average stop | Holding medium or long-term trends | Price can whipsaw around the average |
| Close-based stop | Avoiding intraday noise | Loss can grow if the close is far below the level |
Stops are not guarantees. Gaps, fast markets and thin liquidity can produce exits far away from the planned level. That is another reason to size trades conservatively and avoid concentrating too much capital in a single name.
Rule 5: Manage portfolio risk, not only trade risk
A trader can follow perfect single-trade rules and still carry too much portfolio risk. The most common reason is hidden correlation.
Five different tickers can behave like one position if they all depend on the same theme, such as artificial intelligence infrastructure, regional banks, biotech financing conditions or crypto liquidity. A trend trader who risks 0.75% on each of five related trades may believe the portfolio risk is spread out. In a sector reversal, those trades may fail together.
This is where portfolio review becomes as important as chart review. Look for exposure by sector, factor, geography, market cap, asset class and catalyst. If several holdings would likely sell off for the same reason, reduce position size or limit new entries in that theme.
Upside's guide to how portfolio comparison can reveal hidden risk is especially relevant for trend traders because many risks do not appear in a single chart. Overlap across ETFs, funds and individual stocks can create larger exposures than expected.
A practical rule is to set a maximum portfolio risk per theme. For example, you might allow several technology trades, but cap the total loss you are willing to take if the whole group reverses. The exact cap depends on your risk tolerance, but the discipline should be explicit.
Rule 6: Separate entry rules from risk reduction rules
Entry rules are designed to get you into trends. Risk reduction rules are designed to keep a bad entry from becoming a portfolio problem. When those rules are blended, traders often rationalize staying in weak positions because the original entry signal looked good.
A better approach is to give each rule a clear purpose. Your breakout rule can say when to buy. Your stop rule can say when the breakout failed. Your position sizing rule can define the maximum damage. Your portfolio rule can prevent one theme from dominating the account.
For entry timing specifically, the companion article on smarter stock trend-following entries explains how to distinguish trend filters from triggers. This article's risk lens adds the next layer: even a clean entry should be rejected if the stop is too far away, the position would overload a theme or the volatility regime has changed.
Rule 7: Plan how you will hold winners
Risk management is not only about cutting losers. It is also about avoiding premature exits from the few trades that drive most of the payoff in a trend strategy.
Many trend traders lose money not because every entry is bad, but because they take small profits quickly and allow losses to reach the full stop. That creates poor asymmetry. If your average winner is smaller than your average loser, your win rate must be high enough to compensate. Trend trading usually works best when winners have room to become meaningfully larger than losers.
A few rules can help:
- Move stops only in the direction of risk reduction, not away from the original invalidation point.
- Use a trailing stop based on structure, volatility or a moving average rather than emotion.
- Consider partial exits only if they are part of the plan before entry.
- Review whether profit-taking rules are cutting your strongest trends too early.
There is no single perfect trailing method. A shorter moving average may protect gains faster but create more whipsaws. A wider volatility stop may capture larger trends but give back more open profit. Pick the method that matches your holding period and temperament, then judge it over a sample of trades rather than one outcome.
Rule 8: Reduce risk when the trend becomes crowded
A trend can be real and still dangerous. As more investors crowd into the same trade, the pool of new buyers can shrink. When the marginal buyer disappears, even good news may fail to push price higher.
Technical signs of crowding often include vertical price action, volume spikes, extreme distance from moving averages and repeated failed breakouts after strong news. Ownership data can add another layer. If many portfolios begin to look the same, the risk of a correlated exit increases.
This is one reason retail investors should not rely on charts alone. Upside Invest is built around verified investor holdings, anonymous portfolio comparison, top performer rankings, trend tracking and alerts on investor moves. Seeing what verified investors are buying, holding and outperforming with can help you distinguish early accumulation from late-stage crowding.
The risk rule is not to sell every popular trend. Strong trends often stay popular for a long time. The rule is to reduce blind exposure when price action, sentiment and ownership all point to the same crowded side of the boat.
Rule 9: Keep a pre-trade risk checklist
A written checklist makes technical trend trading less dependent on mood. It also helps you audit your behavior after losses.
Before entering a trade, answer these questions in writing:
- What trend filter makes this trade eligible?
- What exact trigger justifies the entry?
- Where is the invalidation point?
- How many dollars will be lost if the stop is hit?
- What position size matches that risk?
- What other portfolio holdings are exposed to the same theme?
- What condition would make you reduce risk before the stop?
- How will you trail or exit if the trade works?
A checklist will not remove uncertainty. It makes uncertainty measurable. Over time, it also shows which mistakes repeat. If most losses come from chasing extended breakouts, the rule needs to address extension. If most losses come from correlated positions, the portfolio cap needs tightening.
A simple technical trend trading risk framework
The following framework is not a complete system, but it shows how the rules fit together.
| Step | Rule | Example |
|---|---|---|
| Market filter | Trade long setups only when the broader market is above a chosen trend filter | Index above rising 200-day average |
| Asset filter | Buy only assets showing relative strength versus the benchmark | Stock outperforming sector or index |
| Entry | Use a breakout or pullback trigger | Close above 20-day high or bounce from rising 50-day average |
| Stop | Place stop at technical invalidation level | Below range low, swing low or volatility buffer |
| Size | Risk a fixed fraction of portfolio equity | 0.25% to 1% per trade, depending on strategy and tolerance |
| Portfolio cap | Limit related exposure | Maximum loss cap per sector, theme or asset class |
| Winner management | Trail risk as the trend develops | Structure stop, ATR stop or moving average exit |
| Review | Track results by setup and market regime | Compare average winner, average loser, drawdown and Sharpe |
The exact settings matter less than consistency. A trader who follows a moderate process with discipline will often do better than a trader who constantly changes indicators after every loss.
How Upside Invest fits into risk management
Technical rules tell you what price is doing. Portfolio intelligence helps you see what investors are actually holding, where conviction is building and where your own allocation may be more exposed than you think.
With Upside Invest, retail investors can compare their portfolios against verified investor behavior while keeping profiles private and anonymous. That matters for risk management because many portfolio problems are easier to see in comparison: too much overlap, too much exposure to one theme, underperformance versus similar investors or a trend that is already heavily owned by top performers.
Return and Sharpe metrics can also help separate attractive trends from noisy gains. A portfolio that rises quickly but does so with extreme volatility may require different position sizes than one with steadier risk-adjusted performance. Trend and momentum tracking can support your watchlist, but the final decision should still pass through your risk rules.
Frequently Asked Questions
What is technical trend trading? Technical trend trading is a rules-based approach that uses price behavior, indicators and chart structure to identify assets moving in a sustained direction. The goal is to participate in trends while using predefined exits and sizing rules to control downside.
What is the most important risk rule for trend trading? The most important rule is to define your maximum loss before entering. That means knowing the invalidation point, calculating position size from that point and avoiding trades where the required stop is too wide for your account.
Should trend traders use stop losses? Most trend traders use some form of stop or exit rule, but it does not have to be a simple intraday stop order. Some use closing prices, moving average breaks, ATR-based exits or structure-based exits. The rule should match the strategy and account for gaps and slippage.
How much should I risk per trade? There is no universal number. Many traders start with a small fixed fraction of portfolio value, then adjust based on volatility, experience, diversification and drawdown tolerance. The key is that the amount should be small enough to survive a normal losing streak.
Can portfolio data improve technical trading decisions? Yes, if it is used as a risk context rather than a shortcut. Verified holdings, ownership trends and portfolio comparisons can help identify crowding, hidden overlap and emerging conviction. Price still matters, but portfolio data can show whether the trade is early, crowded or highly correlated with what you already own.
Turn trend signals into a disciplined process
Technical trend trading works best when signals, sizing and portfolio risk are part of one repeatable system. If you want to see how your holdings compare with verified investors, identify concentration risks and track what top performers are buying or holding, explore Upside Invest.
Use the charts to find trends, but use risk rules to decide what those trends are worth. Past performance never guarantees future returns, and this article is for educational purposes only, but a clear process can help you make fewer emotional decisions when markets move fast.