Technical Trend Indicators Traders Actually Use
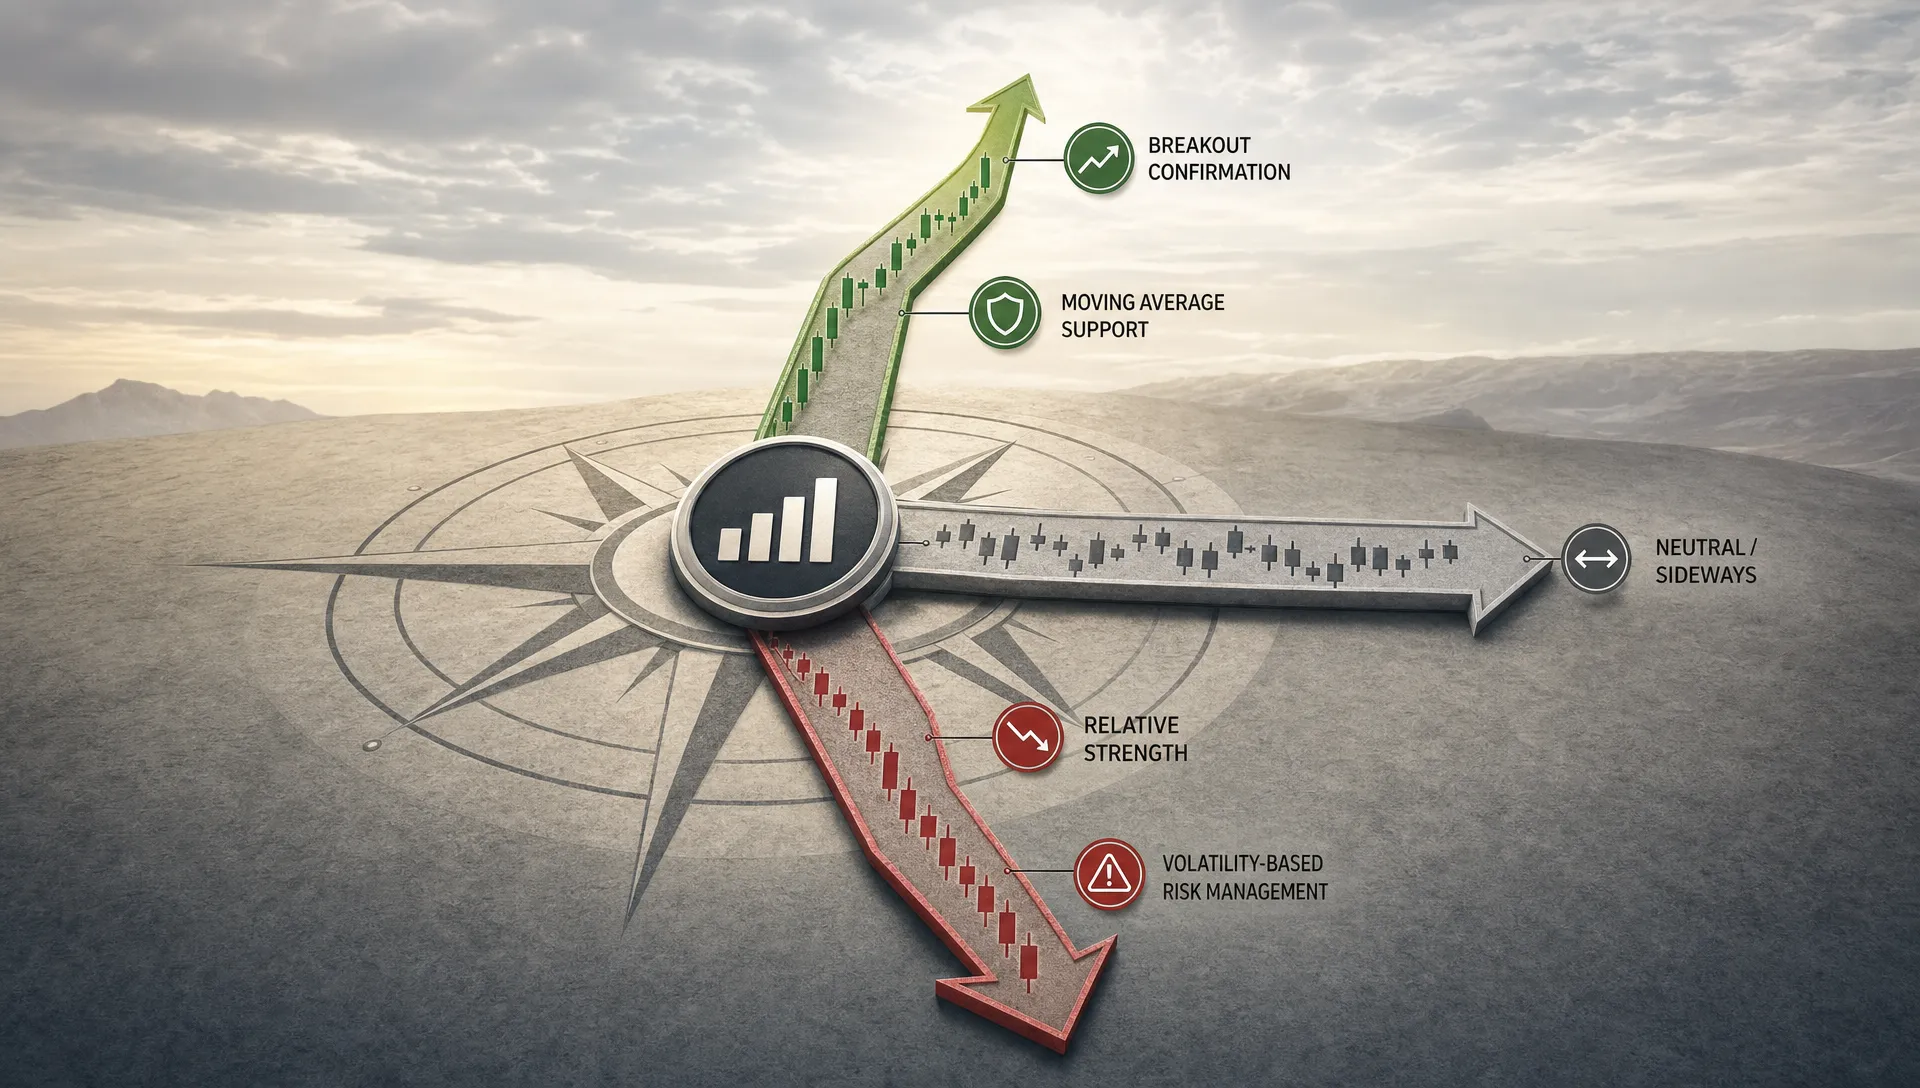
Most traders do not need a chart covered in twenty colorful lines. The technical trend indicators that survive in real trading desks, discretionary workflows, and systematic strategies tend to be simple, testable, and tied to clear decisions: stay with the trend, avoid chop, size risk, or get out when the thesis is no longer valid.
That does not mean these indicators predict the future. They do not. A good trend indicator helps you answer a more practical question: is price behavior strong enough, persistent enough, and broad enough to justify taking or holding risk?
Below are the technical trend indicators traders actually use, how they are applied, and where they often fail.
What Makes a Trend Indicator Worth Using?
A useful trend indicator should do at least one of four jobs. It should identify direction, measure trend strength, confirm participation, or define risk. If an indicator does not improve one of those decisions, it usually adds noise.
| Indicator job | Question it answers | Common tools |
|---|---|---|
| Direction | Is the asset trending up, down, or sideways? | Moving averages, price channels, trendlines |
| Strength | Is the trend gaining or losing force? | ADX, slope, relative strength, momentum ranks |
| Confirmation | Is the move supported by participation? | Volume, relative volume, breadth, VWAP |
| Risk control | Where is the trend likely invalidated? | ATR, trailing stops, prior swing levels |
The best traders also match the indicator to the timeframe. A 200-day moving average may matter to a position trader, while VWAP may matter more to someone trading intraday. Problems start when traders mix signals from unrelated timeframes, such as buying a five-minute breakout while ignoring that the stock is still below a declining 200-day moving average.
For a deeper look at how these tools fit into broader systems, Upside has a separate guide to trend following strategies that still work in 2026. This article focuses specifically on the indicators traders rely on day to day.
Moving Averages: The Trend Filter That Still Matters
Moving averages are popular because they solve a basic problem: markets are noisy, and traders need a cleaner way to see direction. A moving average smooths price over a chosen period, making it easier to distinguish a trend from random fluctuation.
Traders usually use moving averages in three ways.
First, they use them as regime filters. If a stock, ETF, or crypto asset is above a rising 200-day moving average, many traders define the long-term trend as positive. If it is below a falling 200-day average, they become more defensive.
Second, they use them as dynamic support or resistance. In a strong uptrend, price may pull back toward a rising 20-day or 50-day moving average before continuing higher. In a downtrend, those same averages can act as resistance.
Third, they use moving average crossovers as confirmation, although experienced traders rarely treat them as automatic buy or sell signals. A 50-day moving average crossing above a 200-day moving average can confirm a strengthening long-term trend, but by the time it happens, much of the initial move may already be underway.
| Moving average | Common use | Best suited for |
|---|---|---|
| 10-day or 20-day | Short-term trend and pullback timing | Active swing trading |
| 50-day | Intermediate trend and institutional reference level | Swing and position trading |
| 100-day | Smoother intermediate trend filter | Lower-turnover strategies |
| 200-day | Long-term risk-on or risk-off filter | Position trading and allocation decisions |
| EMA | Faster response to recent price changes | Shorter-term trading |
| SMA | Cleaner long-term smoothing | Trend filters and benchmark levels |
The main weakness of moving averages is lag. They work best in persistent trends and worst in sideways markets. If price keeps crossing above and below the same moving average, the market is probably range-bound, and a trend-following tool is the wrong instrument for the job.
Breakouts and Price Channels: The Market Proving Itself
A breakout is one of the oldest trend signals because it is based on a simple idea: if price moves above a level where sellers previously stopped it, demand may be changing.
Traders often track breakouts using:
- Prior swing highs and lows
- 20-day, 55-day, or 52-week highs
- Donchian channels
- Consolidation ranges
- Opening range breakouts for intraday trading
Breakouts are especially useful because they force traders to wait for evidence. Instead of guessing that a stock is ready to trend, the trader waits for price to clear a meaningful level.
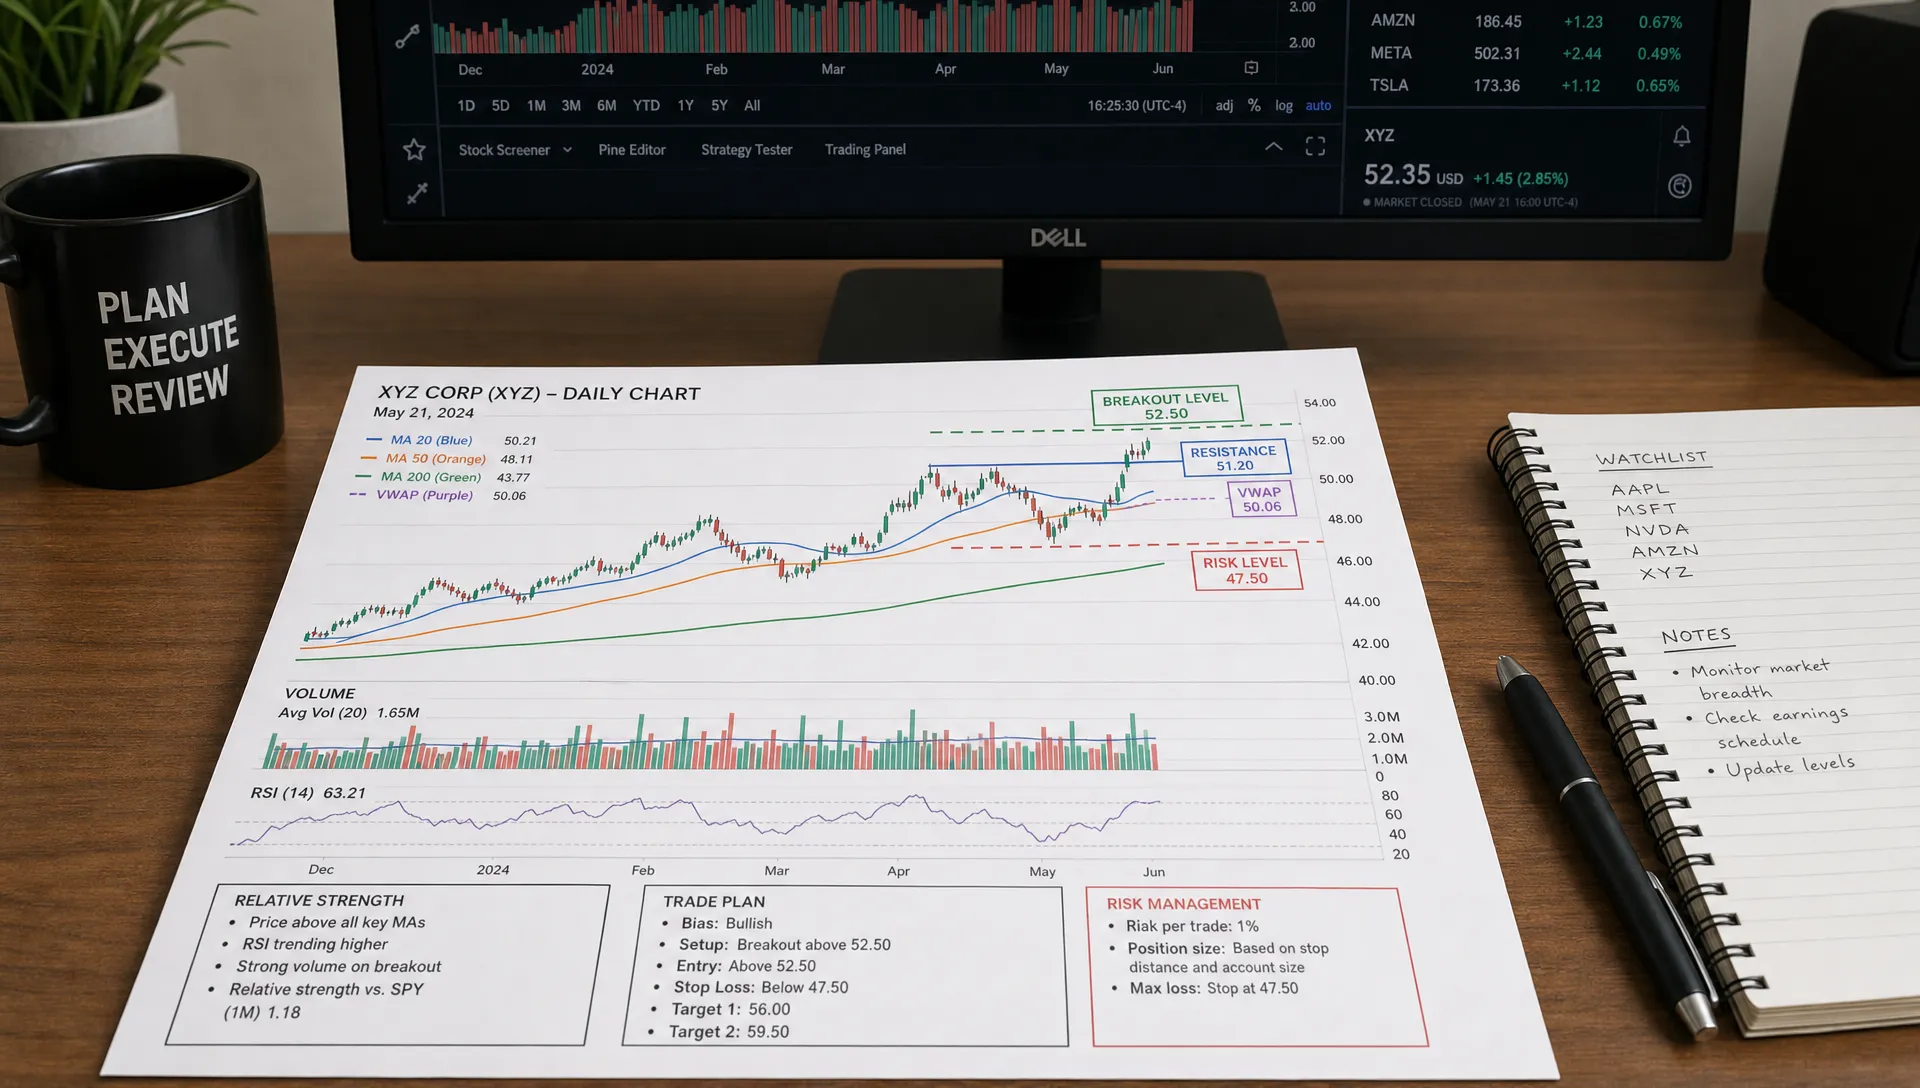
The challenge is false breakouts. A stock can briefly move above resistance, attract momentum buyers, then reverse hard if follow-through disappears. Traders reduce this risk by looking for confirmation: a strong close above the breakout level, expanding volume, relative strength versus the market, and a clean invalidation point if the breakout fails.
This is where price action becomes more useful when paired with ownership and positioning context. A breakout that is also appearing in verified investor portfolios may deserve more attention than a price move with no visible accumulation. Upside covers this combined approach in its guide on how to spot trending trades before the crowd.
Relative Strength: The Indicator Pros Respect
Relative strength is one of the most practical technical trend indicators because it asks a better question than “is this going up?” It asks: is this going up more than the alternatives?
That distinction matters. A stock can rise 8 percent while the market rises 12 percent, which means it is actually underperforming. Another stock can stay flat during a market selloff, which may indicate hidden strength.
Traders use relative strength in several ways:
- Comparing a stock against the S&P 500, Nasdaq 100, or its sector ETF
- Ranking assets by 3-month, 6-month, or 12-month performance
- Watching whether relative strength makes new highs before price does
- Favoring sectors where multiple stocks are outperforming together
Relative strength is not the same as RSI, the Relative Strength Index. RSI measures the speed and magnitude of recent price changes within one asset. Relative strength compares one asset against another.
Why does this indicator matter so much? Because strong trends often begin with leadership. The stocks that resist weakness early, outperform during recoveries, and keep making relative highs are often the names institutions are accumulating. Traders want to be where capital is flowing, not where price merely looks cheap.
ADX: Trend Strength Without Directional Bias
The Average Directional Index, usually called ADX, is useful because it does not try to tell you whether price is going up or down. It tells you whether a trend is strong.
ADX is commonly interpreted on a 0 to 100 scale. Many traders view readings below 20 as weak or range-bound, while readings above 25 suggest a more meaningful trend. A rising ADX can indicate that trend strength is increasing, whether that trend is bullish or bearish.
This makes ADX helpful for deciding which strategy type fits the market. If ADX is low and price is moving sideways, breakout and trend-following systems may struggle. If ADX is rising while price is breaking out of a base, the market may be shifting into a more directional phase.
The mistake is using ADX alone. A high ADX after a long move can also mean the trend is extended. It should be paired with price structure, volatility, and risk levels.
VWAP and Anchored VWAP: Where Institutions Often Care
VWAP, or volume-weighted average price, is widely used by intraday traders because it shows the average price traded during the session, weighted by volume. It is not just a retail chart line. Institutional desks often use VWAP as a benchmark for execution quality.
For active traders, VWAP can act as a real-time reference point. If price is above VWAP and holding, buyers may be in control during that session. If price repeatedly fails at VWAP, sellers may be dominating.
Anchored VWAP extends the same idea over a custom period. Instead of starting at the market open, traders anchor VWAP to an important event, such as an earnings gap, major breakout, capitulation low, or high-volume reversal day. This can reveal whether buyers from that event are still profitable or under pressure.
VWAP is most useful when connected to context. A stock reclaiming anchored VWAP after strong earnings may be more meaningful than a random VWAP cross in a low-volume session.
ATR: The Risk Tool Trend Traders Rely On
Average True Range, or ATR, is not a directional trend indicator, but traders use it constantly because trends are only useful if risk is controlled. ATR measures recent volatility, helping traders avoid stops that are too tight for the asset’s normal movement.
A stock that moves 1 percent per day and a crypto asset that moves 6 percent per day cannot be managed with the same stop distance. ATR helps normalize that difference.
| ATR use case | How traders apply it | Why it matters |
|---|---|---|
| Stop placement | Set stops a multiple of ATR below entry or below a swing level | Reduces random stop-outs |
| Position sizing | Take smaller positions in higher-volatility assets | Keeps risk consistent |
| Trailing exits | Move stops as the trend advances | Lets winners run while defining downside |
| Breakout filters | Compare breakout size to normal volatility | Helps separate real expansion from noise |
A common mistake is using ATR mechanically without considering structure. If a logical support level is much closer than the ATR stop, the trade may not have enough room. If the ATR stop is far beyond the point where the chart thesis is invalidated, risk may be too large.
Breadth and Participation: Is the Trend Broad or Narrow?
Market breadth indicators help traders judge whether a trend is supported by many securities or only a few large names. This is especially important for index traders and investors making allocation decisions.
Useful breadth measures include the percentage of stocks above their 50-day or 200-day moving averages, advance-decline lines, new highs versus new lows, and sector participation. A rally with broad participation is usually healthier than one driven by a small group of mega-cap stocks.
Breadth does not need to be complicated. If the index is making new highs while fewer stocks are participating, the trend may be vulnerable. If more sectors begin participating after a narrow rally, the trend may be broadening.
What About MACD, RSI, Bollinger Bands, and Ichimoku?
These indicators are also used by traders, but they are often best treated as secondary tools rather than the foundation of a trend process.
MACD is built from moving averages, so it can help identify changes in momentum. It is useful when a trader wants to see whether momentum is improving or deteriorating, but it can be noisy in choppy markets.
RSI is commonly thought of as an overbought or oversold indicator, but in trending markets it can be more useful as a regime tool. Strong uptrends often hold RSI above the 40 to 50 zone on pullbacks. Strong downtrends often fail near the 50 to 60 zone.
Bollinger Bands can help identify volatility expansion. In strong trends, price can “walk the band” longer than mean-reversion traders expect. This is why automatically shorting an upper band touch is dangerous.
Ichimoku is a complete trend framework with support, resistance, momentum, and cloud structure. Some traders use it effectively, but it has more components than most beginners need.
How Traders Combine Indicators Without Creating Noise
The best indicator combinations are not random. Each tool should have a separate job. If you combine five indicators that all measure the same thing, you are not getting confirmation. You are getting duplication.
| Trading style | Practical indicator stack | What the stack is trying to confirm |
|---|---|---|
| Long-term trend follower | 200-day moving average, 6-month or 12-month relative strength, ATR stop | Positive regime, leadership, defined risk |
| Swing trader | 20-day and 50-day moving averages, breakout level, volume, ATR | Direction, trigger, participation, risk |
| Intraday trader | VWAP, opening range, relative volume, prior day levels | Session control and execution quality |
| Portfolio investor | Trend filter, sector relative strength, verified holdings behavior | Price trend plus investor positioning context |
A simple rule helps: before adding an indicator, write down what decision it changes. If it does not change entry, exit, sizing, timing, or avoidance, remove it.
This is where traders can borrow from other disciplines. Teams focused on growth marketing and innovation often test one variable at a time, measure outcomes, and iterate based on evidence. Traders should treat indicator combinations the same way: define the signal, test it, track results, and avoid changing five things at once.
The Biggest Mistakes Traders Make With Trend Indicators
Trend indicators are useful, but they can become dangerous when traders treat them as certainty. A moving average does not know that earnings are tomorrow. ADX does not know that a crowded trade is running out of buyers. VWAP does not know that a macro headline is about to change the session.
The most common mistakes are:
- Using too many correlated indicators, such as multiple moving average tools that all say the same thing
- Ignoring timeframe conflict, such as trading a short-term bullish setup inside a long-term downtrend
- Treating lagging indicators as if they are forecasts
- Forgetting that breakouts can fail when buyers are already crowded
- Taking signals without a predefined invalidation level
The last point matters most. Every trend trade needs a line where the thesis is wrong. That line may be a failed breakout, a break of a moving average, a close below anchored VWAP, or a volatility-adjusted stop. Without that line, an indicator becomes decoration.
Traders should also remember that strong trends can reverse precisely because they become too popular. Upside explains that risk in more depth in why trades trending today can reverse tomorrow.
Where Portfolio Intelligence Fits In
Technical indicators show what price is doing. They do not always show who is buying, whether strong investors are involved, or whether a move is becoming crowded.
That is where portfolio intelligence can add a different layer of context. Upside Invest is built around anonymous, verified investor holdings, portfolio comparison, trend and momentum tracking, top performer rankings, return and Sharpe metrics, and alerts on investor moves. Used alongside chart-based indicators, this kind of data can help traders and investors ask better questions.
For example, a breakout may be more interesting if verified investors with strong track records have been increasing exposure. A relative strength leader may deserve closer attention if it is also gaining ownership across portfolios. A crowded momentum trade may require tighter risk controls if everyone appears to be leaning the same way.
The point is not to replace technical analysis. It is to add context that a chart alone may miss.
Frequently Asked Questions
What are the most reliable technical trend indicators? The most widely used technical trend indicators are moving averages, price breakouts, relative strength, ADX, VWAP, breadth, and ATR-based risk tools. None is reliable in every market, but each helps answer a specific trading question.
Is RSI a trend indicator? RSI is usually classified as a momentum oscillator, but traders often use it in trend analysis. In strong uptrends, RSI tends to hold higher ranges on pullbacks. In downtrends, RSI often fails at lower resistance zones.
Do professional traders use moving averages? Yes, many professional and institutional traders use moving averages as reference levels, regime filters, and risk management tools. They rarely use them in isolation, and they understand that moving averages lag price.
Is VWAP only for day trading? Standard VWAP is mostly used for intraday trading, but anchored VWAP can be useful over longer periods when tied to important events such as earnings gaps, breakout dates, or major lows.
How many trend indicators should I use? Most traders are better off with three to five indicators that each serve a different purpose. A practical setup might include one direction filter, one strength measure, one confirmation tool, and one risk tool.
Turn Trend Signals Into Better Investing Context
Technical trend indicators are most powerful when they are combined with real-world positioning and disciplined risk management. Charts can show direction, but verified portfolio data can help reveal whether investors are actually committing capital.
With Upside Invest, you can compare your portfolio, see verified investor holdings, track trends and momentum, follow top performer rankings, and discover sectors or themes gaining attention, all while profiles remain private and anonymous. Use technical signals to identify the trend, then use portfolio intelligence to understand the context behind it.