6 Momentum Trading Indicators for Stronger Setups

Momentum trading indicators help answer a practical question: is demand still expanding, or are you arriving after the clean part of the move?
A strong setup is not just a stock, ETF or crypto asset going up. It usually combines trend direction, improving momentum, confirmation from volume or relative strength and a defined risk point. The six indicators below are useful because each one measures a different part of that picture. Used together with restraint, they can help you avoid late entries, weak breakouts and crowded moves that look better on a chart than they trade in real life.
What makes a momentum setup stronger?
Momentum is the tendency for assets that have recently outperformed to keep outperforming over a defined period. The idea has been studied for decades, including in the widely cited 1993 Journal of Finance paper by Jegadeesh and Titman, which examined intermediate term return continuation in stocks.
For traders, the challenge is not proving that momentum exists. The challenge is separating tradable momentum from noise, exhaustion and market beta. A stock can rise because the whole market is rising. It can also spike because of a one day catalyst, then fade once short term buyers leave.
Good momentum trading indicators should help you answer four questions:
- Is price moving faster than it was before?
- Is the move broad enough to trust, or is it a thin breakout?
- Is the asset outperforming its benchmark or just floating with the market?
- Where is the setup invalidated if momentum fails?
If you want a wider technical foundation before narrowing into momentum, Upside Invest has a related guide to technical trend indicators traders actually use, including moving averages, VWAP, ADX, ATR and breadth.
The 6 momentum trading indicators at a glance
| Indicator | What it measures | Best use | Common mistake |
|---|---|---|---|
| Rate of Change | Percentage price change over a lookback period | Spotting acceleration or loss of thrust | Using a lookback that does not match your holding period |
| RSI | Strength of recent gains versus losses | Identifying bullish or bearish momentum regimes | Treating every overbought reading as a sell signal |
| MACD Histogram | Difference between MACD and its signal line | Detecting shifts in momentum acceleration | Entering before price confirms the turn |
| ADX with DI lines | Trend strength and directional pressure | Filtering weak trends from strong ones | Forgetting that ADX does not show direction by itself |
| Relative Strength Line | Performance versus a benchmark or peer group | Finding leaders before obvious breakouts | Confusing marketwide rallies with real outperformance |
| Volume Momentum | Participation behind price movement | Confirming breakouts and pullbacks | Trusting price moves on weak participation |
1. Rate of Change (ROC)
Rate of Change is one of the cleanest momentum indicators because it measures how far price has moved over a chosen period.
A simple version is:
ROC = ((Current Price - Price n periods ago) / Price n periods ago) x 100
If a stock was $50 twenty trading days ago and is $60 today, its 20 day ROC is 20 percent. That tells you the recent move was not just positive, it had measurable speed.
The key is matching the lookback to the trade. A swing trader might test 20 day, 63 day and 125 day ROC to represent roughly one, three and six months of price action. A day trader would use much shorter windows. A longer term investor may care more about six or twelve month momentum.
ROC works best when it is used as a ranking and confirmation tool. For example, if two stocks are breaking out of similar bases but one has positive and rising 63 day ROC while the other has barely positive ROC, the first one likely has stronger sponsorship from buyers.
A simple ROC setup might look like this: price is above a rising 50 day moving average, 63 day ROC is positive and improving and the asset is breaking above a recent consolidation. That does not guarantee continuation, but it filters out many weak charts that are technically up but not accelerating.
The main risk is chasing vertical moves. A very high ROC reading can mean strength, but it can also mean the trade is extended. Check distance from moving averages and recent volatility before assuming faster is always better.
2. Relative Strength Index (RSI)
RSI is often taught as an overbought and oversold indicator. That is too narrow for momentum trading. In a strong trend, RSI can stay elevated longer than short sellers expect.
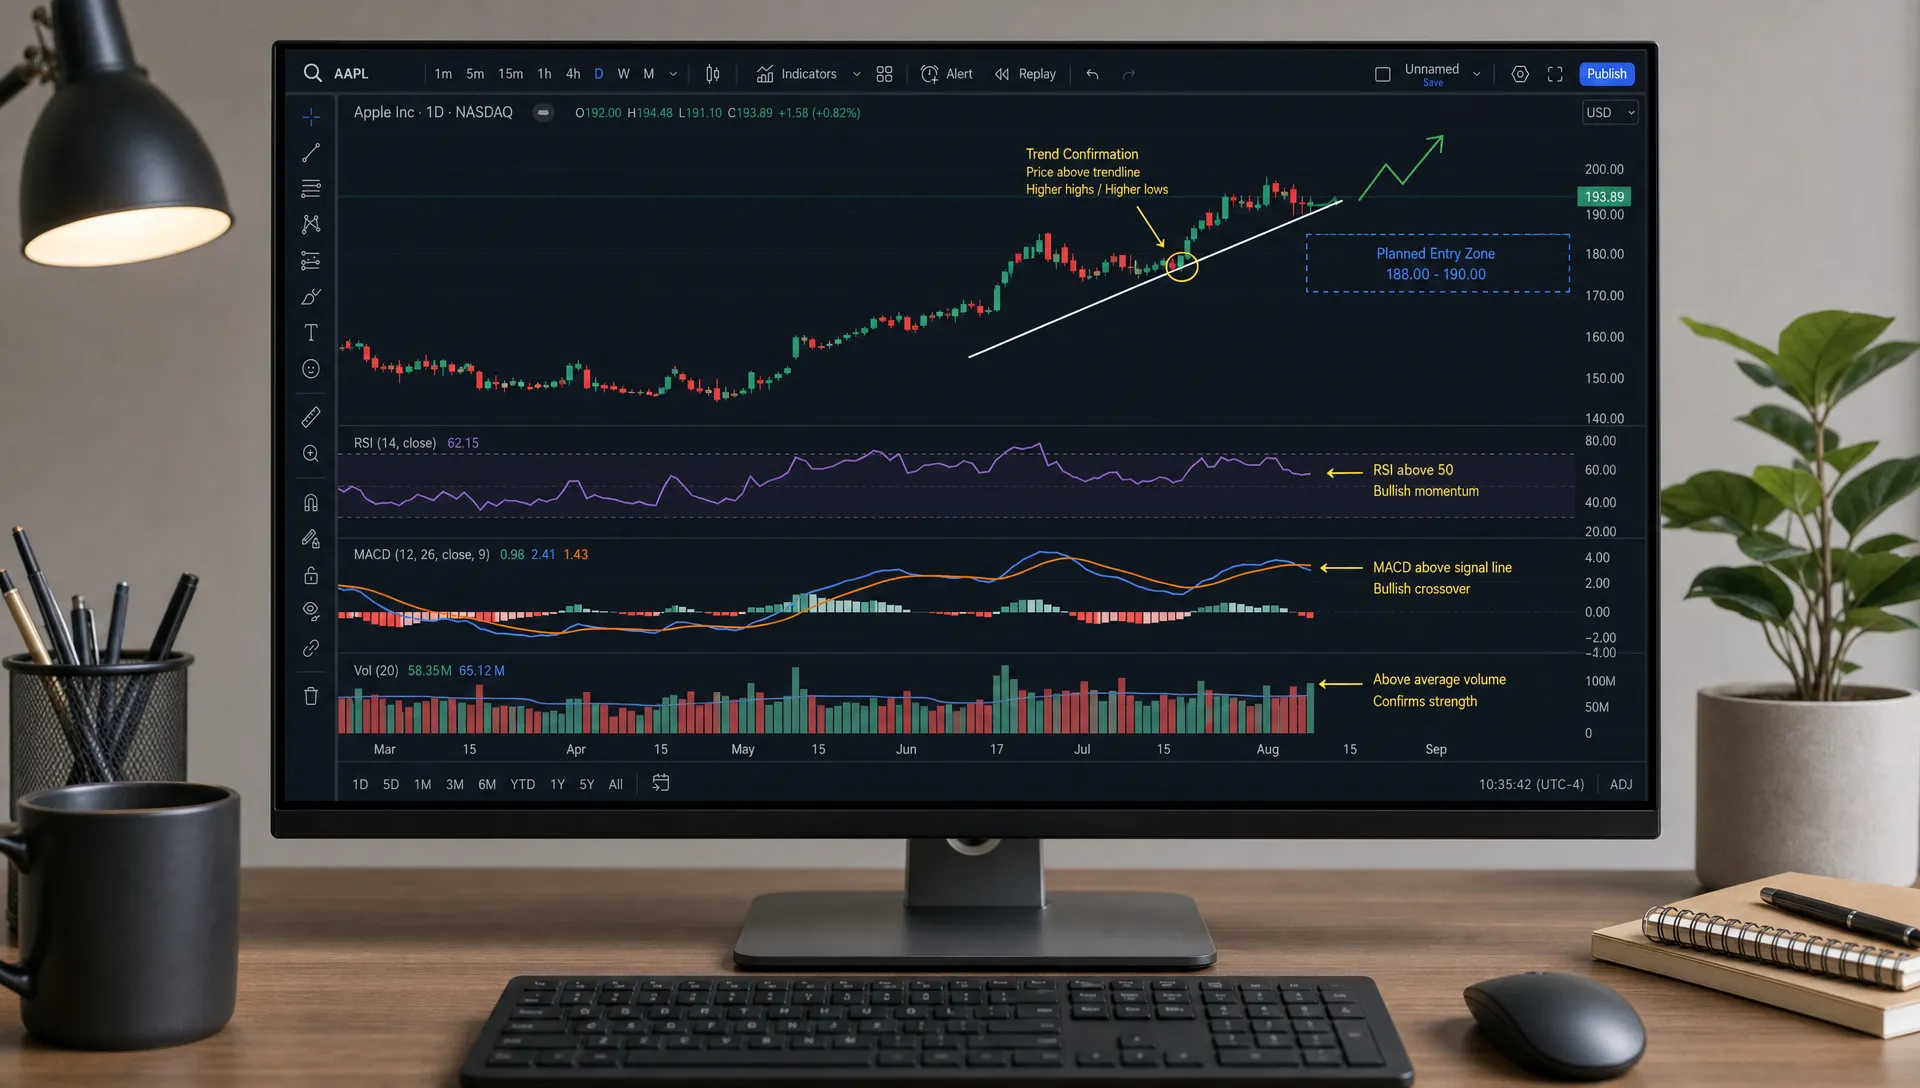
For bullish setups, many traders watch whether RSI can hold above 40 during pullbacks and push back above 50 or 60 as price turns higher. In strong uptrends, RSI often lives in a higher range, such as 40 to 80, instead of falling repeatedly into deeply oversold territory.
For bearish setups, the reverse often applies. RSI may struggle below 60 and break under 40 during selloffs, showing that sellers are controlling the rhythm.
RSI can strengthen a setup in three ways. First, it can confirm that price strength is supported by recent gains outpacing losses. Second, it can show whether a pullback is orderly or damaging. Third, it can reveal momentum divergence, where price makes a new high but RSI fails to confirm.
Divergence is useful, but it is not a standalone entry signal. A stock can show bearish RSI divergence and still grind higher for weeks. Use divergence as a warning to tighten criteria, not as permission to fight the trend without price confirmation.
3. MACD Histogram
MACD uses moving averages to show changes in momentum. The common default settings compare 12 and 26 period exponential moving averages, then plot a 9 period signal line. The MACD histogram shows the distance between MACD and that signal line.
For momentum traders, the histogram is often more useful than the crossover alone because it shows acceleration. When histogram bars move from negative toward positive, downside momentum may be fading. When positive bars expand, upside momentum is accelerating. When positive bars shrink while price keeps rising, momentum may be losing force.
A stronger long setup often has three pieces: price holding above a key moving average, the MACD histogram crossing from negative to positive and a breakout or higher low confirming the shift. If only the histogram turns up while price remains below resistance, the signal is weaker.
MACD is slower than ROC or RSI because it is built from moving averages. That lag is not always a flaw. For traders who tend to react too early, MACD can help filter out minor wiggles. For traders seeking very early entries, it may confirm later than desired.
4. ADX with Directional Movement
ADX, or Average Directional Index, measures trend strength. It does not tell you whether the trend is up or down by itself. That is why it is often paired with the positive and negative directional indicators, usually shown as +DI and -DI.
A rising ADX suggests the trend is strengthening. Many traders treat readings above 20 or 25 as evidence that a trend has enough strength to matter, though exact thresholds vary by asset and timeframe. If +DI is above -DI while ADX rises, bullish directional pressure is stronger. If -DI is above +DI while ADX rises, bearish pressure is stronger.
ADX is useful because momentum setups often fail in choppy markets. A breakout with flat or falling ADX may still work, but the odds of whipsaw are higher because trend strength is not expanding.
The common mistake is buying simply because ADX is high. A very high ADX can also appear late in a move, after the clean entry has passed. ADX is best used as a filter: it helps decide whether the market is trending enough to use momentum tactics, not whether the entry price is attractive.
5. Relative Strength Line
Relative strength compares an asset with a benchmark, sector ETF or peer group. A basic relative strength line can be created by dividing the asset price by the benchmark price. If the line is rising, the asset is outperforming. If it is falling, the asset is underperforming.
This is not the same as RSI. RSI measures internal price momentum. Relative strength measures performance against an alternative.
Relative strength is valuable because many apparent momentum trades are really marketwide moves. If the S&P 500 is rallying hard and your stock is up 3 percent while the index is up 4 percent, the stock may not be a leader. It is participating, but lagging.
A strong bullish signal appears when the relative strength line hits a new high before price breaks out. That means the asset is already gaining ground versus its benchmark, even if the absolute price chart has not attracted broad attention yet.
This is where portfolio and ownership context can add another layer. Price based indicators tell you what the chart is doing, but they do not show whether stronger investors are building exposure. Upside Invest explains this broader signal stack in its guide on how to spot trending trades before the crowd, which combines price action, verified portfolio behavior and catalyst analysis.
6. Volume Momentum
Volume momentum asks whether participation is expanding behind the price move. A breakout on heavy volume is usually more meaningful than a breakout on thin volume because more capital is involved in pushing price through resistance.
There are several ways to measure it. Some traders compare current volume with the 20 day average. Others use On Balance Volume, which adds volume on up days and subtracts volume on down days. Intraday traders may also use VWAP to judge whether buyers are maintaining control above the session average price.
Volume can confirm both breakouts and pullbacks. On a breakout, expanding volume suggests new demand is entering. During a pullback, declining volume can suggest sellers are not aggressive. The combination of a low volume pullback into support followed by a high volume reversal can create a cleaner setup than buying a breakout blindly.
Volume is less reliable in assets with fragmented markets, unusual reporting patterns or event driven spikes. Crypto, small caps and thinly traded names can show distorted volume signals. In those cases, combine volume with spread, liquidity and slippage checks before sizing a trade.
How to combine indicators without overloading the chart
The strongest setups usually combine different types of evidence rather than six versions of the same idea. RSI, MACD and ROC all measure momentum in different ways, but they can become redundant if used without a clear role.
A cleaner approach is to assign each indicator a job:
| Job | Useful indicator | Setup question |
|---|---|---|
| Trend filter | Moving average or ADX | Is the market trending enough for momentum tactics? |
| Momentum confirmation | ROC, RSI or MACD | Is price strength improving or fading? |
| Leadership check | Relative strength line | Is the asset outperforming its benchmark? |
| Participation check | Volume momentum | Are buyers or sellers showing up with conviction? |
| Risk planning | ATR, swing levels or invalidation zones | Where is the trade wrong? |
One overlooked part of setup building is indicator budgeting. Traders can be careful about position size but careless about data and tool bloat. The same audit mindset companies use for software costs can help. Procurement specialists such as SaaSed's Salesforce renewal negotiation support review usage, SKUs and leverage before renewal talks. For your trading process, review which indicators actually changed decisions, which ones repeated the same signal and which ones added noise.
If an indicator never changes your entry, exit or position size, it is decoration. Remove it or define its role more clearly.
A practical momentum setup checklist
A simple checklist can prevent emotional entries when a chart looks exciting. It also makes your process easier to review after the trade.
- Price is above a relevant trend filter, such as a rising 50 day or 200 day moving average.
- ROC is positive and improving on the timeframe that matches the planned holding period.
- RSI is in a bullish regime, or recovering from an orderly pullback without breaking down.
- MACD histogram supports acceleration, or at least no longer shows clear deterioration.
- Relative strength versus the benchmark is rising or near a new high.
- Volume expands on breakouts and contracts during pullbacks.
- The invalidation point is known before entry, not invented after the trade moves against you.
This checklist is deliberately strict. You will miss some trades. That is acceptable if the trades you do take are cleaner, easier to size and easier to exit.
For entries specifically, trend followers often do better when they separate the trend filter from the trigger. A moving average can define the environment, while a breakout, pullback reversal or volatility contraction can define the actual entry. Upside covers this distinction in more depth in stock trend following rules for smarter entries.
Risk rules matter more when momentum is strong
Momentum can make traders feel late and rushed. That is when bad sizing, wide stops and vague exits creep in.
Before entering, decide whether the trade is invalidated by a close below a moving average, a break of a swing low, a failed breakout level or a volatility based stop. The best choice depends on the asset and timeframe, but the rule must be clear enough to follow under pressure.
Position size should come from the distance to the stop, not from how confident the setup feels. A high momentum stock may need a wider stop because volatility is higher. If you ignore that and use the same share size as a slower moving stock, your real risk can be much larger than planned.
Momentum setups also need review after major catalysts. Earnings, regulatory news, macro data and unexpected guidance can reset the chart. If the original reason for the trade changes, the indicator stack may no longer matter.
Frequently Asked Questions
What is the best momentum trading indicator? There is no single best momentum trading indicator for every market. ROC is useful for ranking acceleration, RSI is helpful for momentum regimes, MACD shows shifts in acceleration and relative strength helps identify leaders. The best choice depends on your timeframe and setup rules.
How many momentum indicators should I use? Most traders only need two or three momentum indicators, plus a trend filter and risk rule. Using RSI, MACD, ROC, ADX, relative strength and volume all at once can work if each has a defined job, but too many overlapping signals often slow decisions.
Is RSI better for momentum or reversals? RSI can be used for both. In momentum trading, RSI is often more useful as a regime tool than a simple reversal signal. A stock that holds RSI above 40 during pullbacks and repeatedly pushes above 60 may be showing healthy bullish momentum.
Do momentum trading indicators work for crypto? They can, but crypto often has higher volatility, thinner liquidity in some assets and more extreme sentiment swings. Use shorter review cycles, account for slippage and avoid assuming that a signal calibrated for large cap stocks will behave the same way in crypto.
Can momentum indicators predict reversals? Momentum indicators can warn that a trend is weakening, but they do not predict reversals with certainty. Divergence, falling volume and a shrinking MACD histogram are caution signs. A reversal still needs price confirmation and a clear risk plan.
Build stronger momentum setups with real portfolio context
Momentum indicators are more useful when you pair them with context. Price, volume and relative strength can show what the market is doing, but verified investor behavior can help you understand whether real portfolios are leaning into or away from a trend.
Upside Invest helps retail investors compare portfolios, view anonymous verified holdings, track trends and momentum, monitor top performers and review return and Sharpe metrics. Use it to add portfolio context to your setup process, then let your risk rules decide whether the trade is worth taking.