7 Stock Insight Websites Worth Using in 2026
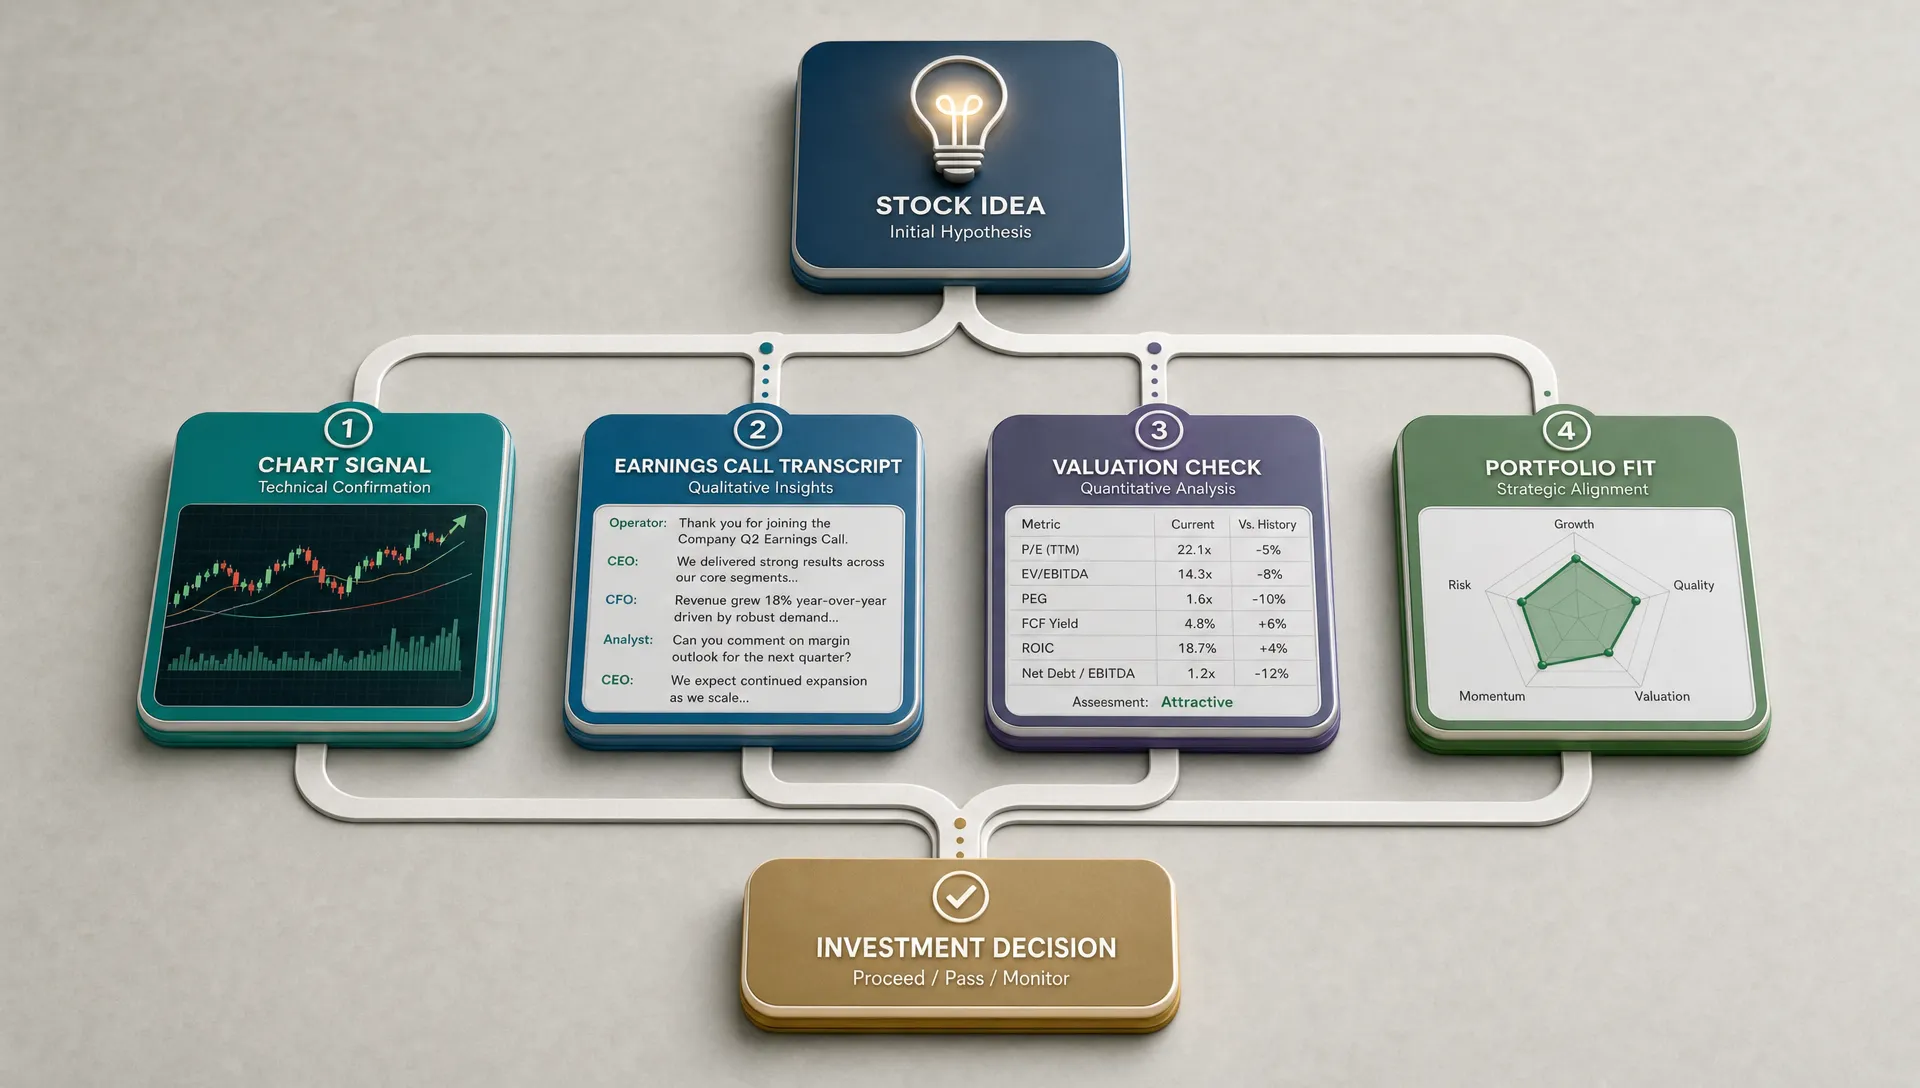
The best investors are rarely short on information. They are short on context. In 2026, a stock quote, a chart, and a few headlines are table stakes. The more useful question is whether a website helps you understand what matters now, what changed, who is acting on it, and how a new idea fits into your existing portfolio.
That is why the best stock insight websites do different jobs. Some help you find ideas. Others help you pressure-test a thesis, compare valuation, read management commentary, track price behavior, or benchmark your own allocation against other investors.
Below are seven stock insight websites worth using in 2026, with a practical view of what each one is best for, where it fits in a research workflow, and what to watch out for before you rely on it.
What makes a stock insight website useful in 2026?
A useful stock insight website should do more than display data. It should reduce uncertainty in a specific part of your process. For retail investors, that usually means answering one of four questions:
- What should I look at?
- What does the market already believe?
- What are informed investors actually doing?
- How does this affect my risk, diversification, and returns?
The strongest platforms also make their data source clear. A social post, a user-written article, a 13F filing, a company transcript, a real-time price chart, and a verified portfolio holding are not the same kind of evidence. Each can be useful, but only if you know what it can and cannot prove.
| Research need | Best type of website | What to verify |
|---|---|---|
| Compare your portfolio with others | Verified holdings and benchmarking platforms | Whether portfolios are real, current, and comparable |
| Find new stock ideas | Screeners, heat maps, trend tools | Whether the signal is already crowded |
| Understand fundamentals | Financial data and company research platforms | Revenue quality, margins, debt, dilution, and estimates |
| Track price action | Charting and alert platforms | Timeframe, liquidity, volatility, and risk controls |
| Read investor arguments | Research communities and analyst commentary | Author incentives, assumptions, and counterarguments |
| Hear directly from management | Earnings call and investor relations platforms | Whether commentary matches reported numbers |
No single website does all of this perfectly. A better approach is to build a small stack, then use each site for the job it is best at.
1. Upside Invest: Best for verified investor holdings and portfolio benchmarking
Upside Invest is built around a simple but powerful idea: investors can learn more from real portfolio behavior than from opinions alone. Instead of only showing articles, ratings, or price action, Upside focuses on verified investor holdings, anonymous profiles, portfolio comparisons, top performer rankings, trend and momentum tracking, and risk-adjusted metrics such as returns and Sharpe ratios.
That makes it especially useful when you want to know how your portfolio compares with other retail investors. Are you more concentrated than investors who have been outperforming? Are you underweight a theme that is showing up repeatedly in verified portfolios? Are your recent trades aligned with broader momentum, or are you simply reacting to news after the move has already happened?
The key advantage is behavioral context. A stock can look attractive on a screener, but it is another thing to see whether verified investors are actually holding it, adding to it, or avoiding it. Upside’s privacy-first, anonymous verification model also matters because it lets investors share portfolio data without turning investing into a public performance contest.
If benchmarking is your main goal, Upside’s guide to how Upside Invest helps you benchmark your portfolio gives more detail on comparing allocations against verified investors rather than relying only on broad market indexes.
Use Upside when you want to understand portfolio behavior, spot emerging themes, compare allocations, and see what high-performing investors are doing with actual holdings data. Do not use it as a substitute for your own risk tolerance, time horizon, or fundamental analysis.
2. Koyfin: Best for market dashboards and fundamental data
Koyfin is one of the most useful platforms for investors who want a more professional research dashboard without jumping straight into institutional terminals. It brings together market data, charts, company financials, valuation metrics, estimates, macro indicators, ETFs, funds, and watchlists in a flexible interface.
Its biggest strength is that it helps you move from idea to context quickly. If a stock appears interesting, you can look at revenue growth, margins, valuation multiples, analyst expectations, historical price performance, and sector comparisons in one place. For investors who like to build repeatable dashboards, that is a major advantage.
Koyfin is especially helpful for comparing companies within the same industry. A software company trading at 12 times revenue means very little in isolation. It becomes more meaningful when you compare its growth rate, gross margin, free cash flow profile, and forward expectations against peers.
The main downside is that more data can create false confidence. A polished dashboard does not automatically tell you which metric matters most. For cyclical companies, leverage and margins may matter more than revenue growth. For banks, capital ratios and credit quality matter. For early-stage growth stocks, dilution and cash burn may be more important than current earnings.
Use Koyfin when you want a structured view of fundamentals, valuation, macro context, and peer comparisons. Pair it with primary sources and portfolio-level tools so your research does not stop at attractive-looking charts.
3. TradingView: Best for charts, technical setups, and alerts
TradingView remains one of the most popular charting platforms because it is fast, visual, and flexible. It supports detailed chart analysis, watchlists, indicators, screeners, alerts, and a large community of traders sharing ideas.
For long-term investors, TradingView can still be useful even if you do not consider yourself a technical trader. Price behavior helps you understand market positioning. A stock making new highs on rising volume tells a different story from a stock drifting sideways while the broader sector rallies. Support, resistance, moving averages, relative strength, and volatility can all help you decide whether to enter gradually, wait, trim, or avoid chasing.
TradingView is also useful for risk management. Alerts can notify you when a stock breaks a key level, reaches a valuation-related price target, or moves sharply relative to its normal range. That helps investors avoid checking prices constantly while still staying aware of important moves.
The weakness is that charting can become addictive. A chart can show what price is doing, but not always why it is happening or whether the move is justified. Community scripts and public trade ideas vary widely in quality. Treat them as prompts for research, not conclusions.
If you use price trends in your process, it is worth combining chart work with a clear ruleset. Upside’s article on trend following strategies that still work in 2026 explains how investors can use trend signals without turning every market move into an emotional decision.
4. Seeking Alpha: Best for investor theses, debates, and earnings commentary
Seeking Alpha is useful because it gives you something raw data often cannot: a written argument. Investors use it to read bullish and bearish theses, follow news, compare ratings, review earnings commentary, and see how different contributors interpret the same company.
This is valuable because good stock research is not just about finding numbers. It is about identifying the assumptions behind those numbers. Why does one investor believe margins will expand while another thinks competition will crush them? Why does one analyst see a cheap valuation while another sees a value trap? What has to happen for the thesis to work?
Seeking Alpha can be especially useful during earnings season. After a company reports, you can compare the headline reaction with deeper commentary. Sometimes the market sells off on guidance that was already expected. Sometimes a stock rallies despite deteriorating fundamentals because expectations were extremely low. Reading multiple interpretations can help you avoid overreacting to the first headline.
The limitation is quality control. Contributor incentives, style, time horizon, and expertise vary. A compelling article may still rely on aggressive assumptions. A bearish article may ignore important upside catalysts. The best way to use Seeking Alpha is to collect arguments, then verify them against filings, transcripts, financial data, and actual portfolio behavior.
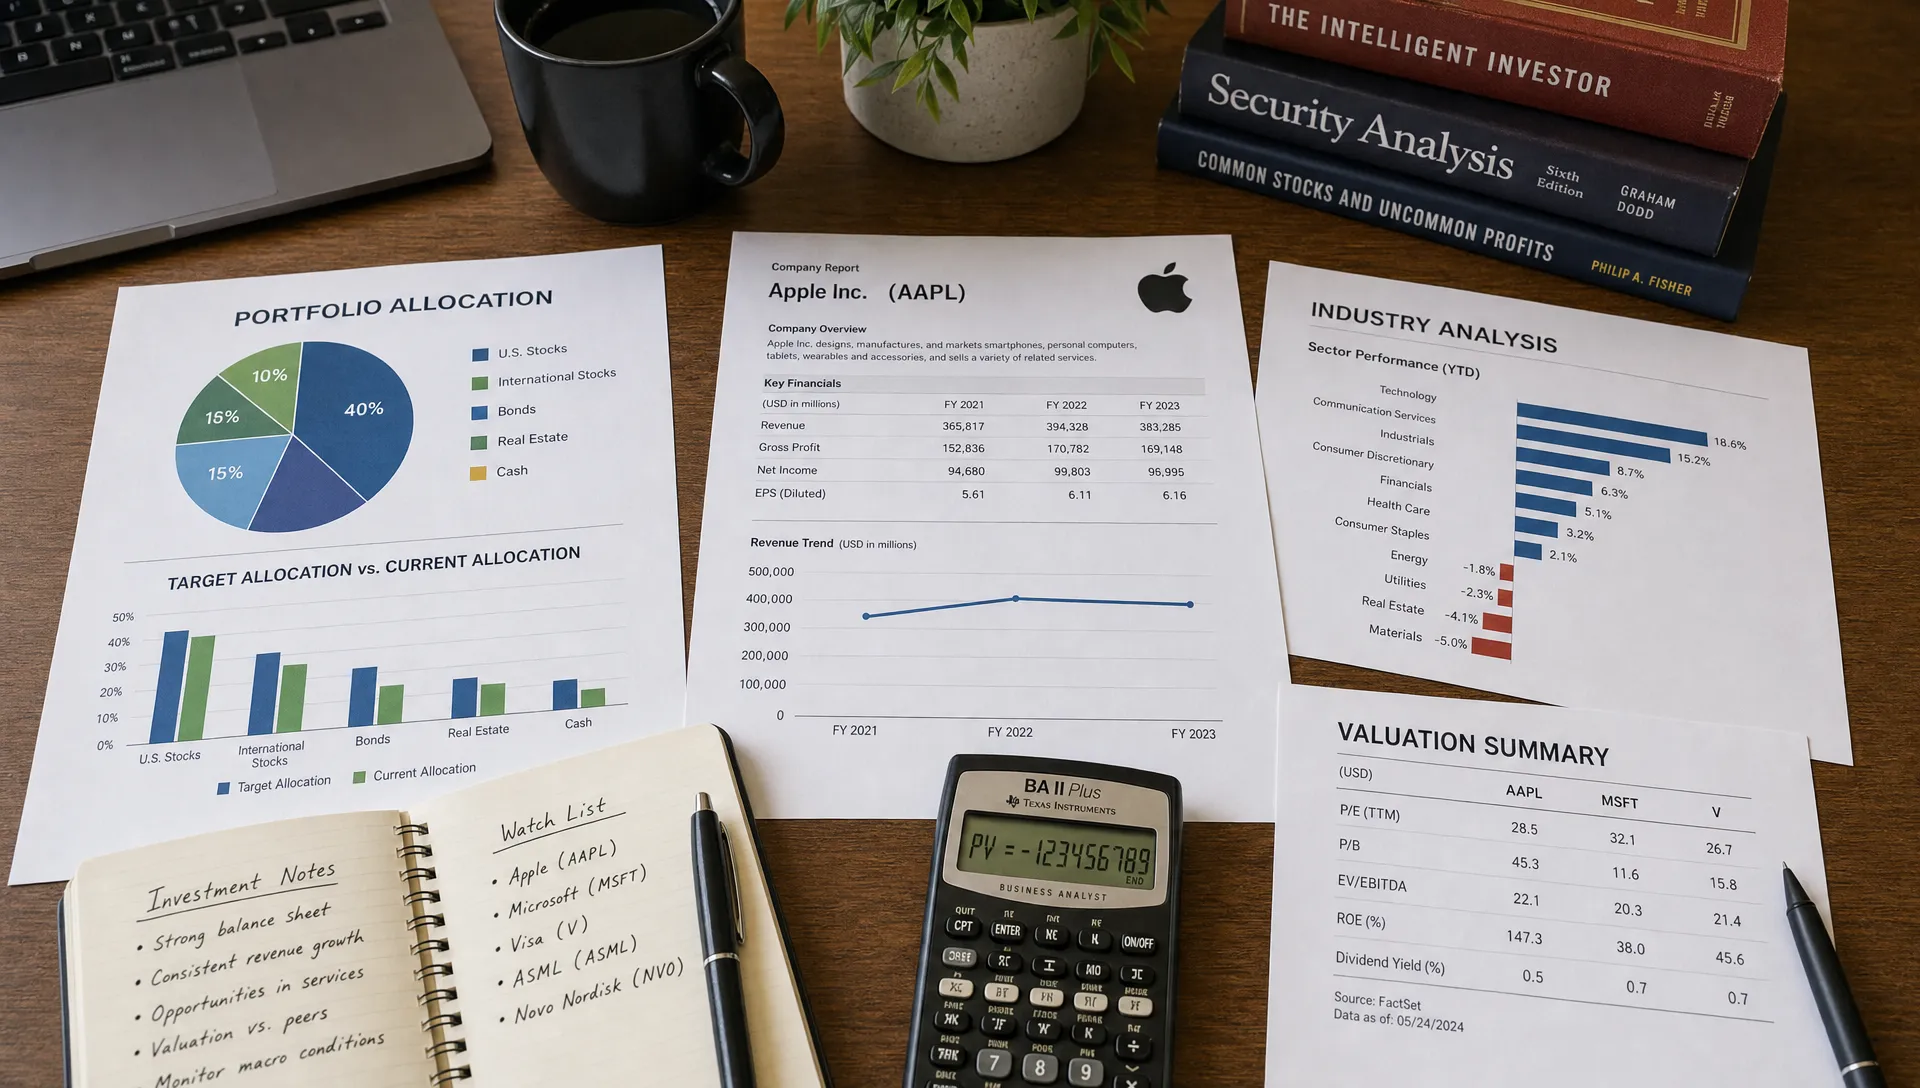
5. Finviz: Best for fast screening, heat maps, and market snapshots
Finviz is one of the fastest ways to scan the market. Its stock screener, sector heat maps, charts, news aggregation, insider transaction views, and performance filters make it helpful for idea generation and quick market orientation.
The platform is particularly useful when you want to narrow a broad universe. You can screen for market cap, valuation, performance, dividend yield, profitability, analyst ratings, sector, country, volatility, and many other variables. That makes it easy to build a first-pass list of candidates before doing deeper research elsewhere.
Finviz’s heat maps are also useful for understanding whether a move is stock-specific, sector-wide, or market-wide. If one semiconductor stock is down 6 percent while the entire semiconductor group is weak, the interpretation is different from a company falling alone after a negative filing or guidance cut.
The biggest risk with any screener is overfitting. If you add enough filters, you can create a list that looks precise but is not necessarily meaningful. A low P/E stock may be cheap, or it may be pricing in declining earnings. A high short interest stock may squeeze, or it may be heavily shorted for good reasons.
Finviz works best at the top of the funnel. Use it to discover names, map market strength, and identify unusual moves. Then validate the idea with financial data, primary sources, and portfolio-level context.
6. Quartr: Best for earnings calls and primary company materials
Quartr is valuable because it brings investors closer to the source. Instead of relying only on summaries, social commentary, or secondhand analysis, investors can use Quartr to access earnings calls, transcripts, investor presentations, and company materials.
That matters because management commentary often contains nuance that does not fit into a headline. A CEO may describe demand as “stable” while also admitting that sales cycles are lengthening. A CFO may reaffirm full-year guidance while quietly pointing to margin pressure in the next quarter. Those details can change how you interpret the numbers.
Quartr is especially useful for investors who follow a concentrated watchlist. If you own or are seriously considering a company, listening to or reading earnings calls over multiple quarters helps you track consistency. Does management explain misses clearly? Do they change key performance indicators? Do they avoid discussing certain risks? Do their capital allocation decisions match their stated priorities?
The limitation is time. Primary-source research is slower than scanning headlines. You do not need to listen to every call for every company. A practical approach is to reserve Quartr for your highest-conviction holdings, watchlist names, and companies where management credibility is central to the thesis.
Ownership data can add another layer when you are reviewing management and shareholder alignment. For a deeper framework, Upside’s guide to stock ownership data every investor should track explains how insider ownership, institutional holdings, float, dilution, and related signals can shape your view of a stock.
7. Yahoo Finance: Best for everyday watchlists, quotes, and news flow
Yahoo Finance remains useful because it is simple, broad, and familiar. It is often the first place investors go for quotes, watchlists, charts, financial statements, analyst estimate snapshots, company profiles, and market news.
Its role in a 2026 research stack is not to be the most advanced platform. Its role is to be convenient. If you want to quickly check how your watchlist is moving, scan major headlines, review basic financials, or see a company’s recent performance, Yahoo Finance is efficient.
That accessibility is also why it works well as a starting point for newer investors. You can learn ticker symbols, sector classifications, market caps, dividend information, earnings dates, and basic valuation metrics without building a complex research dashboard.
The tradeoff is depth. Yahoo Finance is strong for quick orientation, but it should not be the only website you use before making a decision. News feeds can emphasize what is recent rather than what is important. Basic valuation data can miss industry-specific context. Analyst estimate summaries are useful, but they do not replace reading the assumptions behind a business.
Use Yahoo Finance for daily monitoring and quick checks. When a stock becomes interesting, graduate the idea to deeper platforms for fundamentals, transcripts, chart structure, and portfolio comparison.
How to build a practical stock insight stack
The best setup is not the one with the most subscriptions. It is the one you will actually use consistently. For most retail investors, a strong stock insight workflow has four layers.
First, use a discovery layer. This is where Finviz, Yahoo Finance, TradingView, and Upside trend signals can help you notice what is moving, what is gaining attention, and what themes are becoming more visible.
Second, use a validation layer. Koyfin, Quartr, and Seeking Alpha can help you understand fundamentals, management commentary, valuation, and the strongest arguments on both sides of a trade.
Third, use a portfolio layer. This is where many investors are weakest. A stock can be a good company and still be a bad addition if it increases concentration, duplicates exposure you already have through funds, or pushes your portfolio into a risk profile you did not intend. Upside Invest is especially relevant here because it focuses on comparison, verified holdings, and investor behavior rather than isolated stock facts.
Fourth, use an operations layer. This matters most if you publish research, manage an investing community, run client reporting, or turn market analysis into repeatable deliverables. In those cases, stock insight websites should not be forced to do workflow automation. For example, teams that need automated research, reporting, CRM, and content operations may benefit from a dedicated AI ops layer for marketing delivery while keeping investment analysis inside purpose-built research platforms.
A simple stack might look like this:
| Investor type | Suggested stack | Main goal |
|---|---|---|
| New retail investor | Yahoo Finance, Finviz, Upside Invest | Learn the market, build watchlists, compare allocations |
| Fundamental investor | Koyfin, Quartr, Seeking Alpha, Upside Invest | Validate business quality and portfolio fit |
| Trend-aware investor | TradingView, Finviz, Upside Invest | Track momentum while monitoring crowding and risk |
| Concentrated stock picker | Koyfin, Quartr, Upside Invest | Deep research plus portfolio-level discipline |
| Investing content creator | Seeking Alpha, Koyfin, Quartr, Yahoo Finance | Source arguments, data, and company commentary |
The key is to assign each website a job. If every platform becomes a place to “check what people are saying,” your process will get noisy. If each platform answers a specific question, your decisions become easier to review and improve.
Common mistakes to avoid when using stock insight websites
The first mistake is confusing popularity with quality. A stock can be trending because it is genuinely improving, or because it has become a crowded trade. Momentum can persist, but it can also reverse quickly when expectations get too high.
The second mistake is mixing time horizons. A day trader’s chart setup, a long-term investor’s valuation thesis, and a dividend investor’s income case may all refer to the same stock but imply very different decisions. Before using any insight, ask: “What time horizon does this signal belong to?”
The third mistake is ignoring portfolio fit. Investors often research stocks one at a time, then accidentally build a portfolio full of overlapping exposures. Five different artificial intelligence stocks may feel diversified because the tickers are different, but they can still depend on the same spending cycle, supply chain, valuation regime, or macro conditions.
The fourth mistake is outsourcing judgment. A website can surface data, show investor behavior, summarize news, or visualize trends. It cannot know your cash needs, tax situation, emotional tolerance for drawdowns, or long-term goals. The best stock insight websites make you a sharper decision-maker, not a passive follower.
Frequently Asked Questions
What are stock insight websites? Stock insight websites are platforms that help investors analyze stocks, market trends, company fundamentals, ownership behavior, price action, news, or portfolio risk. The best ones turn raw information into context that supports better decisions.
Which stock insight website is best for retail investors in 2026? It depends on the job. Upside Invest is strong for verified investor holdings and portfolio comparison, Koyfin for fundamentals, TradingView for charts, Finviz for screening, Quartr for earnings calls, Seeking Alpha for investor theses, and Yahoo Finance for everyday monitoring.
Should I use free or paid stock research tools? Free tools can be enough for watchlists, basic screening, and market news. Paid tools may be worth it if they save time, improve data quality, or support a repeatable process. The better question is whether the tool improves your decisions enough to justify the cost.
Can stock insight websites tell me what to buy? They can provide useful signals, but they should not replace your own analysis. A good website helps you understand valuation, risk, behavior, momentum, and portfolio fit. It does not remove uncertainty or guarantee returns.
How many stock insight websites should I use? Most investors only need three to five regularly. Choose one for discovery, one for fundamentals, one for charts or news, and one for portfolio comparison. Add specialized tools only when they solve a clear problem.
Turn stock insight into portfolio intelligence
A better investing process is not about opening more tabs. It is about seeing your decisions in context. Which ideas are gaining traction? Which investors are acting on them? Where are you concentrated? Which holdings are helping your risk-adjusted performance, and which ones are quietly adding risk?
That is the gap Upside Invest is built to fill. By combining verified investor holdings, anonymous portfolio sharing, comparison tools, trend tracking, top performer rankings, and portfolio metrics, Upside Invest helps retail investors move beyond isolated stock research and understand how real portfolios are positioned.
Use the websites above to find and validate ideas. Use portfolio intelligence to decide whether those ideas actually deserve a place in your account.