Asset Allocation Comparison That Reveals Portfolio Drift
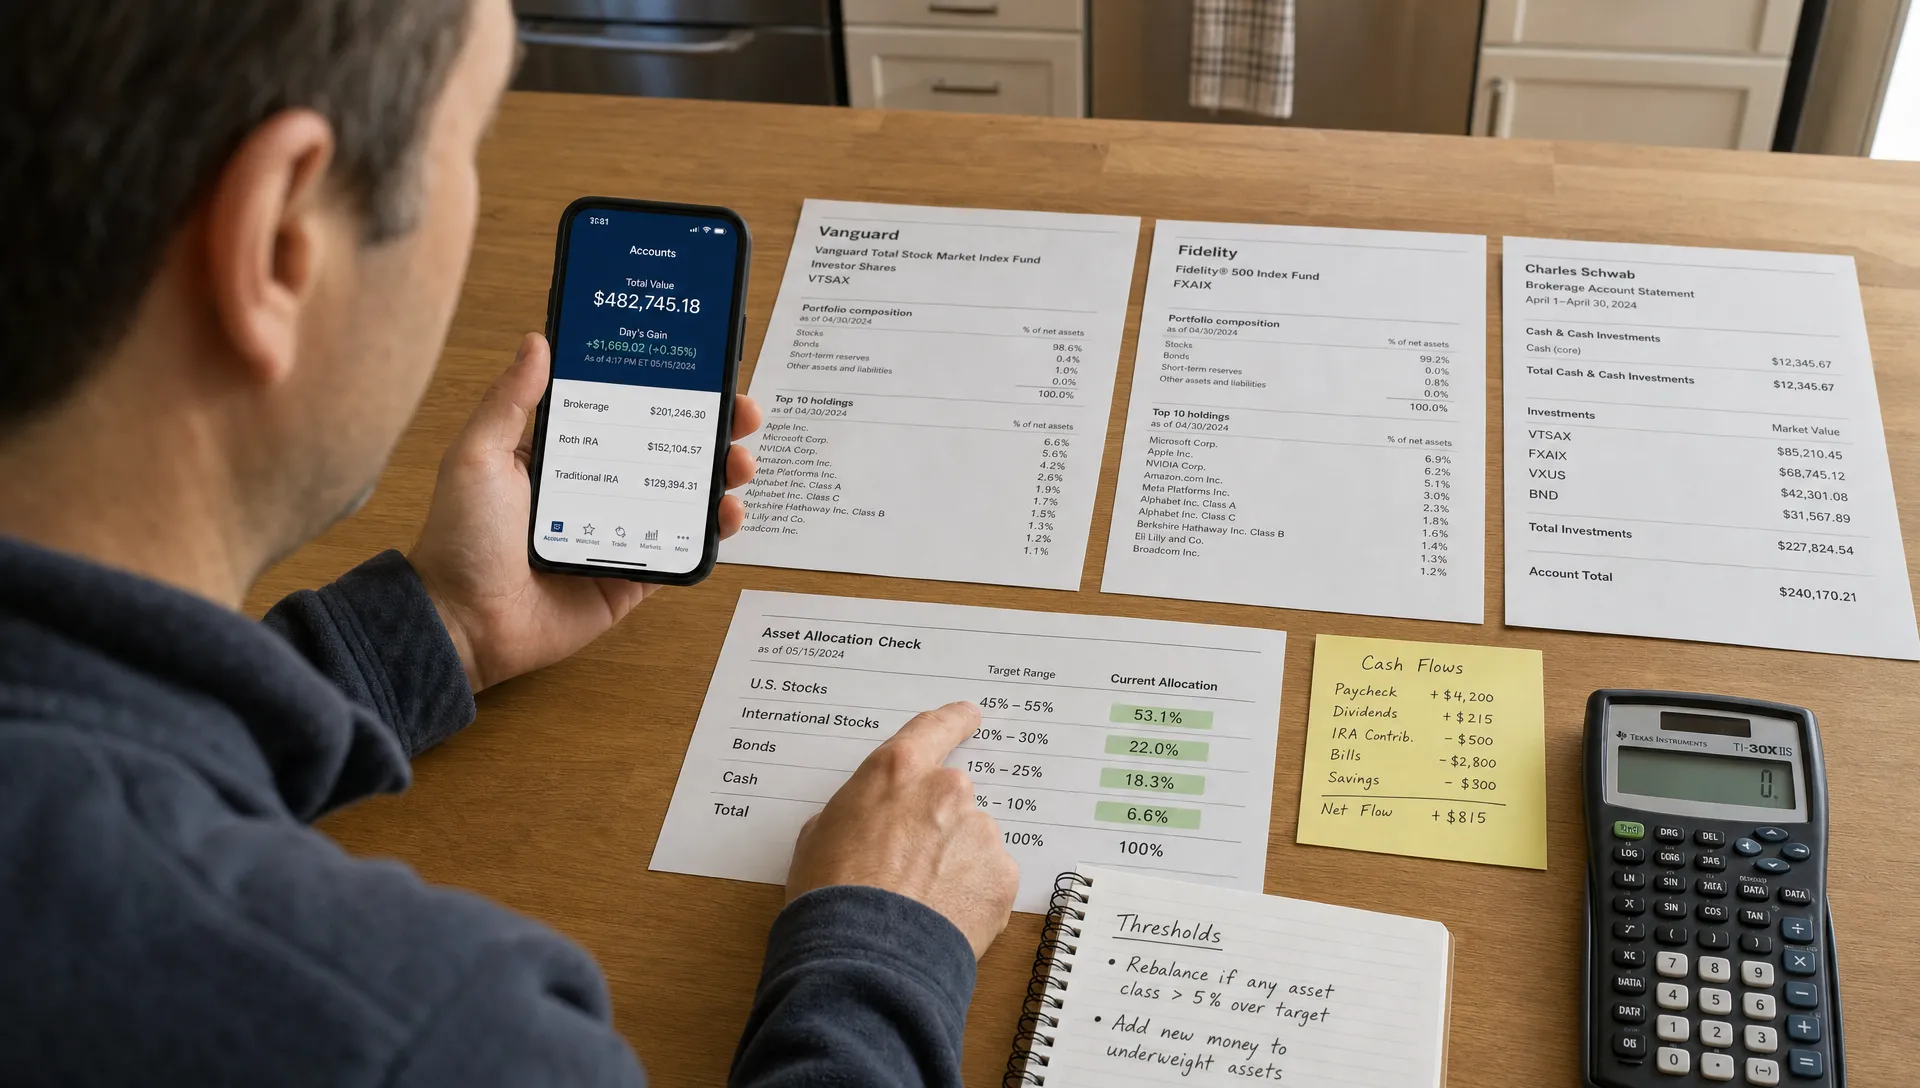
Portfolio drift is one of the quietest ways an investment plan changes without your permission. Nothing has to go wrong. No single position has to crash. A portfolio can simply move, month after month, until the risk you own is no longer the risk you intended to take.
That is why asset allocation comparison matters. It is not just a tidy exercise for annual reviews. It is a practical way to see whether market gains, new deposits, withdrawals, fund overlap, crypto volatility or a few winning stocks have pulled your portfolio away from its original purpose.
For retail investors, the goal is not to rebalance every small move. The goal is to know when drift is meaningful enough to affect expected returns, volatility, liquidity and behavior under stress.
What portfolio drift actually means
Portfolio drift happens when your current asset mix differs from your target asset mix. If your plan calls for 70% stocks and 30% bonds, but a strong equity market pushes you to 78% stocks and 22% bonds, your portfolio has drifted toward more equity risk.
The simplest formula is:
Drift = current allocation weight minus target allocation weight
If U.S. equities were targeted at 40% and now sit at 48%, the drift is plus 8 percentage points. That is different from saying the allocation increased by 8%. Relative to the original 40% target, it increased by 20%. Both views can be useful, but percentage points are usually clearer for rebalancing decisions.
Drift is not automatically bad. Sometimes it reflects the reward for staying invested in a rising asset class. The problem begins when drift changes your portfolio’s behavior in ways you have not consciously accepted. A growth portfolio may become speculative. A balanced portfolio may become stock heavy. A diversified portfolio may become a disguised bet on one sector, geography or mega cap cluster.
Why asset allocation comparison beats a simple performance check
Performance tells you what happened. Allocation comparison tells you what you now own.
Two investors can both be up 15% in a year, but one may have achieved it with a diversified stock and bond portfolio, while the other may now be heavily dependent on five technology stocks and one crypto position. A return chart alone treats those outcomes as similar. Allocation analysis separates luck, concentration and intentional risk.
This is especially important after strong market runs. Investors often feel safer when balances are higher, but their portfolios may be more fragile because winners now dominate the total account. The same issue can happen in reverse after a selloff. A portfolio may drift away from risk assets, leaving the investor underexposed when the market recovers.
A good comparison should include your target allocation, your current allocation, a relevant benchmark and enough detail to see what sits under funds and ETFs. If you want a broader framework for looking beyond headline gains, Upside has a useful guide on how to compare investment portfolios without focusing only on returns.
A practical framework for comparing allocation drift
Start with an investment policy, even if it is simple. You do not need a 20 page document. You need a written target that defines what each part of the portfolio is supposed to do.
A target allocation might separate assets by stocks, bonds, cash and alternatives. A more advanced version might break stocks into U.S., international developed, emerging markets, small cap, sector funds and individual holdings. The right level of detail depends on the decisions you actually make.
Here is an illustrative drift table for a balanced investor:
| Asset sleeve | Target allocation | Current allocation | Drift | What it may signal |
|---|---|---|---|---|
| U.S. equities | 45% | 53% | +8 pp | Equity risk has increased after outperformance |
| International equities | 20% | 16% | -4 pp | Home market exposure may now dominate |
| Bonds | 25% | 19% | -6 pp | Downside cushion and income role may be smaller |
| Cash | 5% | 7% | +2 pp | New contributions or dividends may be idle |
| Alternatives | 5% | 5% | 0 pp | Allocation is in line at the sleeve level |
This table does not say what to buy or sell. It identifies where the portfolio no longer matches the plan. From there, you can ask whether the new allocation is intentional, tax efficient and still appropriate for your time horizon.
Classification matters most when a holding is not a tidy public market fund. For example, a private company focused on shipping containers for sale would usually be driven by industrial demand, logistics, steel costs and local real estate use cases, not by the same factors as a broad consumer stock. The same principle applies to real estate partnerships, private credit, commodities, business ownership and thematic funds. Put assets in the bucket that reflects their economic drivers, not just their account label.
The types of drift that can hide inside a portfolio
The most obvious drift is asset class drift, such as stocks rising from 60% to 72% of the portfolio. That is important, but it is only the first layer.
Sector drift can be just as meaningful. A broad market ETF, a growth fund and several individual technology stocks may look diversified by ticker count, but the portfolio may be leaning heavily on the same earnings cycle, valuation regime and investor sentiment. This risk often grows slowly because the strongest holdings become a larger share of the total portfolio.
Fund overlap is another source of hidden drift. If three ETFs all hold the same mega cap names, the investor may think they own three strategies when they actually own one large overlapping exposure. Looking through the fund wrapper to the underlying holdings helps reveal this. Upside covers this problem in more detail in its guide to compare funds overlap without missing risk.
Risk factor drift can also matter. A portfolio that started with a mix of value, quality and broad market exposure may shift toward momentum if recent winners dominate. A dividend portfolio may drift toward utilities and financials. A bond allocation may drift toward more duration, more credit risk or more cash like exposure depending on fund performance and reinvestment choices.
Crypto and single stock positions deserve special attention because their weight can change quickly. A 3% position can become 8% in a strong rally. That may be acceptable for an investor with a high risk tolerance, but it should be a conscious choice rather than a surprise discovered after volatility returns.
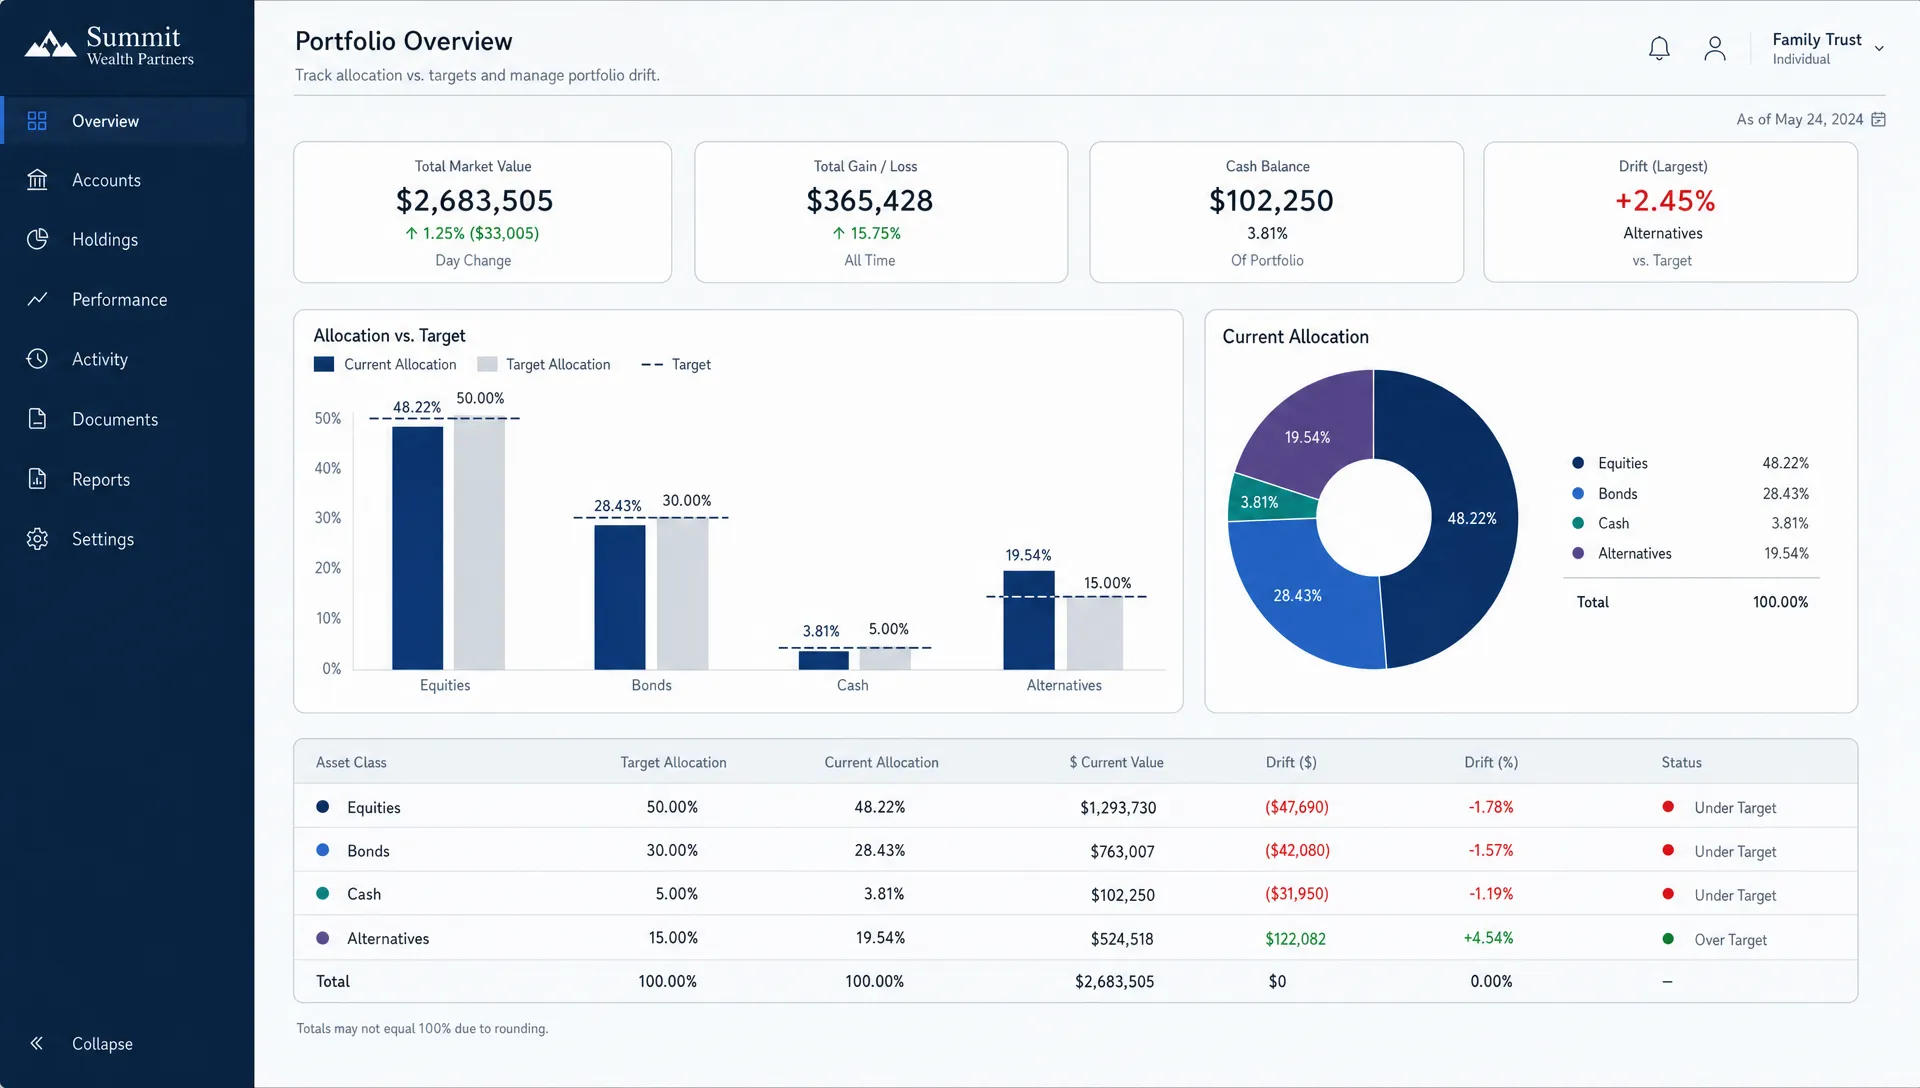
Compare to your target, your benchmark and real investor behavior
The first comparison is always against your own target. Your target reflects your goals, risk tolerance, time horizon and liquidity needs. A 30 year old aggressive investor and a retiree drawing income can both experience drift, but the right response will not be the same.
The second comparison is against a benchmark. This helps you separate personal allocation drift from normal market movement. If global equities rose sharply, your equity sleeve may have outperformed for reasons that are easy to understand. If your portfolio drifted more than a comparable benchmark, the cause may be concentration, active fund tilts or repeated contributions to the same winners.
The third comparison is against other investors, but this requires care. Peer behavior can be useful when it shows what verified investors are holding, adding or avoiding. It becomes dangerous when it turns into blind copying. The right question is not whether someone else owns more of a position. The better question is whether their allocation exposes a trend, risk or opportunity you had not evaluated.
That is where anonymous portfolio intelligence can help. Seeing verified holdings and top performer behavior can create useful context, especially when paired with risk metrics such as return and Sharpe. The value is not in replacing your judgment. The value is in making your comparison set wider than your own spreadsheet.
Rebalancing rules that turn drift into a decision
Once you can measure drift, you need rules for what to do with it. Otherwise, every market move becomes an emotional debate.
The most common approaches are calendar rebalancing, threshold rebalancing and cash flow rebalancing. Many investors use a hybrid approach, reviewing on a schedule but acting only when drift exceeds a preset band.
| Rebalancing rule | How it works | Best suited for | Main tradeoff |
|---|---|---|---|
| Calendar based | Review monthly, quarterly or annually | Investors who want routine discipline | May trigger trades when drift is small |
| Threshold based | Act when an allocation moves beyond a set band | Investors focused on risk control | Requires more monitoring |
| Cash flow based | Use new deposits, dividends or withdrawals to restore balance | Taxable accounts and long term investors | May be too slow during large market moves |
| Hybrid | Review on a schedule and trade only past thresholds | Most self directed investors | Needs clear rules in advance |
A simple rule might be to review quarterly and rebalance if a major sleeve is more than 5 percentage points away from target. For smaller allocations, a relative threshold can be better. If emerging markets are targeted at 5%, a move to 8% is only 3 percentage points, but it is a 60% relative increase in that sleeve.
Taxes and trading costs matter. In taxable accounts, it can be better to redirect new contributions, reinvest dividends selectively or rebalance inside tax advantaged accounts before selling appreciated positions. Drift analysis should inform the decision, not force unnecessary transactions.
What your drift says about your investing behavior
Allocation drift is not caused only by markets. It also reflects investor behavior.
Repeatedly buying recent winners can create momentum drift. Avoiding lagging asset classes can create valuation drift. Letting cash pile up after a selloff can create timing drift. Adding new thematic funds without reducing old exposures can create complexity drift.
This is why the comparison should include a transaction review. Ask which changes came from market movement and which came from your own choices. A portfolio that drifts because equities rallied is different from one that drifted because you kept adding to the same high conviction idea after every positive headline.
There is also a psychological benefit. Drift checks reduce the need to make decisions based on market noise. Instead of asking whether stocks feel expensive, you can ask whether stocks are now too large relative to your plan. That is a cleaner question and usually a more useful one.
Common mistakes when comparing asset allocation
One mistake is comparing only high level sleeves. A portfolio can look balanced at 70% stocks and 30% bonds, yet still be concentrated in one country, one sector or one duration profile. The top level allocation is the starting point, not the full diagnosis.
Another mistake is ignoring accounts outside the main brokerage. A 401(k), IRA, taxable account, cash reserve, crypto wallet and equity compensation can all affect real exposure. If you compare only one account, the drift calculation may be technically accurate but financially incomplete.
A third mistake is treating all drift as a problem. Some drift is normal and even desirable if it reflects a long term risk premium you intended to capture. Constantly trimming every winner can reduce compounding and increase taxes. The key is to distinguish healthy drift from uncontrolled concentration.
Finally, investors often compare themselves to the wrong benchmark or peer group. A portfolio designed for moderate growth should not be judged against a 100% technology stock basket during a bull market. The comparison has to match the portfolio’s job.
How often should you run an asset allocation comparison?
For most long term investors, quarterly is enough. Monthly can be useful for investors with concentrated positions, meaningful crypto exposure, active contributions or a portfolio spread across several platforms. Daily checking usually creates more noise than insight unless the strategy is explicitly active.
A useful review rhythm looks at three questions each time:
- Has any major allocation moved outside its allowed range?
- Has any single holding, sector or theme become large enough to change portfolio risk?
- Can new cash flows correct the drift without triggering unnecessary taxes?
If the answer to all three is no, the best action may be to do nothing. A drift check is not a trading signal by itself. It is a risk awareness tool.
Frequently Asked Questions
What is asset allocation comparison? Asset allocation comparison is the process of measuring your current portfolio weights against a target allocation, benchmark or peer group. It helps show whether your portfolio still matches your intended risk and return profile.
How much portfolio drift is too much? There is no universal number, but many investors use threshold bands such as 5 percentage points for major asset classes. Smaller or more volatile sleeves may need relative thresholds because a small percentage point move can be large compared with the original target.
Should I rebalance as soon as I see drift? Not always. Minor drift is normal. Rebalancing decisions should consider taxes, trading costs, account type, time horizon and whether the drift has materially changed portfolio risk.
Can portfolio drift improve returns? Yes, drift toward outperforming assets can improve returns for a period. The tradeoff is that the portfolio may become more concentrated and volatile. Higher returns are only helpful if the investor can tolerate the added risk.
What is the difference between allocation drift and fund overlap? Allocation drift measures how far your current asset mix has moved from target. Fund overlap measures whether different funds hold the same underlying securities or exposures. Overlap can cause hidden drift even when the number of funds looks diversified.
Make portfolio drift visible before it becomes a problem
The hardest part of managing drift is not the math. It is seeing the full picture clearly enough to make calm decisions.
Upside Invest helps investors compare portfolios using real investor data, anonymous verified profiles, holdings intelligence, trend tracking, top performer rankings, return and Sharpe metrics and AI portfolio recommendations. Use it to see how your allocation has changed, how it compares with others and where hidden concentration may be forming.
You do not need to react to every move. You do need to know when your portfolio has stopped being the portfolio you planned to own.