How to Compare Funds Overlap Without Missing Risk
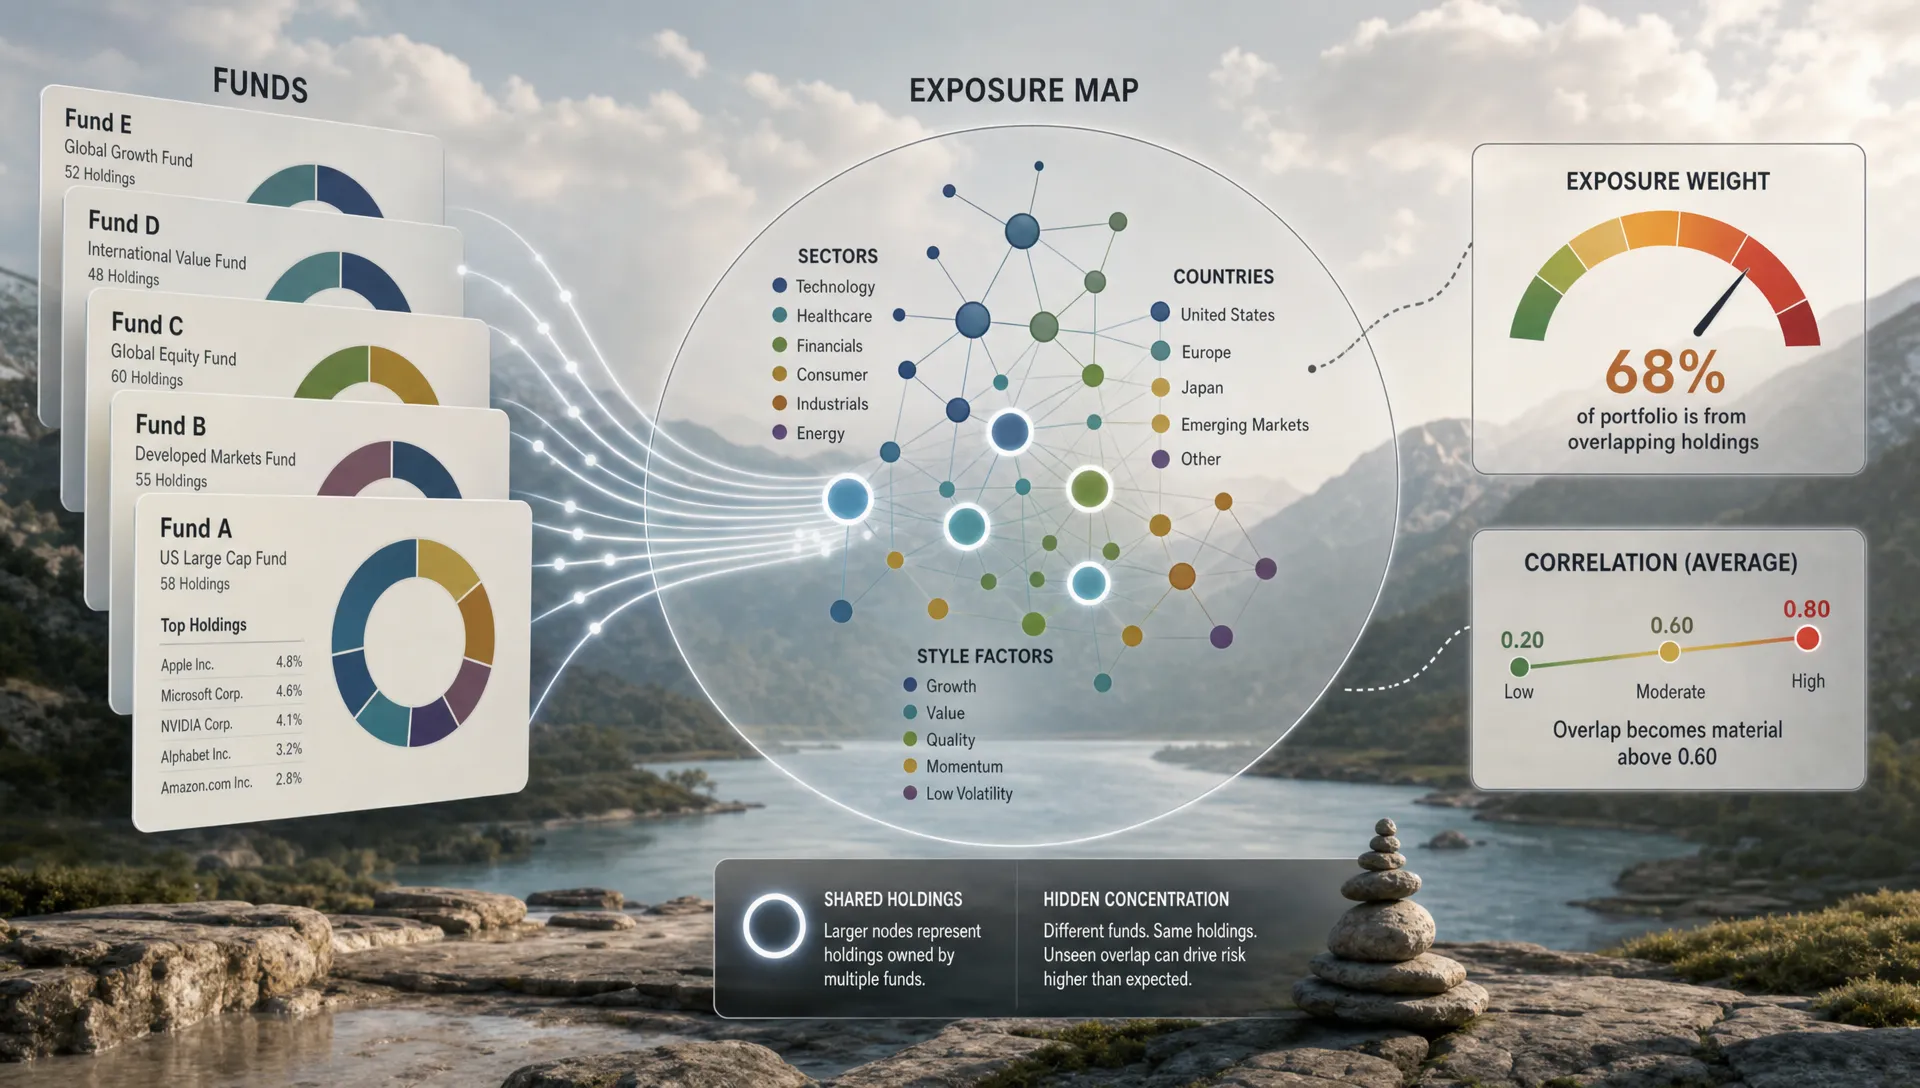
Fund overlap is one of the easiest risks to underestimate because it often hides behind labels that sound diversified. You may own a large-cap ETF, a technology fund, an ESG fund, a dividend fund, and a target allocation fund, yet still have a portfolio driven by the same handful of mega-cap stocks or the same macro factor.
That does not automatically mean your portfolio is wrong. Overlap can be intentional, especially when you want more exposure to a company, sector, region, or style. The problem is not overlap itself. The problem is unrecognized overlap.
To compare funds overlap properly, you need to go beyond fund names and top-line performance. You need to understand what each fund owns, how much those holdings matter to your total portfolio, and whether the combined exposure matches the risk you think you are taking.
Why fund overlap matters more than it looks
Most investors compare funds by expense ratio, recent return, star rating, distribution yield, or broad category. Those inputs are useful, but they do not tell you whether two funds are giving you different exposures.
For example, a broad market ETF and a growth ETF may both hold several of the same large technology companies. A global equity fund and a US equity fund may overlap heavily if the global fund has a large US allocation. A balanced fund may hold underlying ETFs that duplicate positions you already own separately.
When this happens, your portfolio can become more concentrated than your account screen suggests. Ten funds can still behave like three exposures if the underlying holdings, sectors, and factors are similar.
Hidden overlap can create several risks:
- Single-stock concentration: A company appears in multiple funds, making your total exposure larger than expected.
- Sector concentration: Different funds hold the same industry theme, such as semiconductors, banks, energy, or health care.
- Factor concentration: Funds with different names may all tilt toward growth, momentum, quality, value, or high beta.
- Benchmark drift: Your portfolio may move far away from the benchmark you think you are tracking.
- False diversification: You may add funds that increase complexity without reducing risk.
If you want a broader framework for spotting these issues across your entire account, Upside Invest also covers portfolio comparison tips that reveal hidden risk. This article focuses specifically on fund overlap and how to measure it without missing the risks that matter.
Start with the right definition of overlap
There is no single perfect overlap number. A useful analysis usually combines several views.
The simplest version is holdings overlap: how many securities appear in both funds. That is a starting point, but it can be misleading. If two funds share 50 holdings but those holdings represent only tiny weights, the risk impact may be small. If they share five holdings that make up 35 percent of each fund, the overlap is much more important.
A better approach is to compare overlap across four layers:
| Overlap layer | What it tells you | Why it matters |
|---|---|---|
| Holdings overlap | Which stocks, bonds, funds, or crypto assets appear in more than one fund | Shows duplicate positions |
| Weight overlap | How much of each fund is allocated to the same holdings | Shows whether duplicates are material |
| Exposure overlap | Whether funds share sectors, countries, factors, duration, or credit risk | Captures risk that is not visible from tickers alone |
| Behavior overlap | Whether funds move similarly in different markets | Reveals correlation and portfolio sensitivity |
This layered view matters because two funds can have low holdings overlap but high risk overlap. For instance, two funds may own different banks but still respond similarly to changes in interest rates, credit conditions, or regulation. Two bond funds may hold different CUSIPs but share the same duration and credit exposure. Two crypto-related products may hold different assets but react to the same liquidity cycle.
Gather the data before you compare
Before you compare funds overlap, create a clean inventory of what you own. This sounds basic, but many overlap errors start with incomplete data.
At minimum, gather the following for each fund:
- Fund ticker and name
- Your portfolio allocation to the fund
- Latest available holdings and weights
- Fund category and benchmark
- Sector, geography, and asset class breakdown
- Expense ratio and distribution policy
- Turnover rate, if available
- Strategy notes, especially for active funds
For ETFs and mutual funds, fund issuers usually publish holdings on their websites. Some funds update daily, while others update monthly or quarterly. Active funds may disclose less frequently than index ETFs. Funds of funds require extra attention because the top holdings may be other funds, not the final underlying securities.
If a fund holds other funds, do not stop at the wrapper. You need to look through to the underlying holdings where possible. Otherwise, a target date fund, balanced allocation fund, or multi-asset ETF can hide duplicates that you already own elsewhere.
Calculate your real exposure, not just fund exposure
The most common mistake is comparing two funds in isolation without considering how much of your portfolio is allocated to each fund.
A holding inside a fund matters only in proportion to both the fund's internal weight and your portfolio weight in that fund.
Use this formula:
Total portfolio exposure to a holding = fund allocation in your portfolio x holding weight inside the fund
Suppose you own two funds:
| Fund | Your portfolio weight | Holding | Holding weight inside fund | Contribution to your portfolio |
|---|---|---|---|---|
| Fund A | 40% | Company X | 8% | 3.2% |
| Fund B | 25% | Company X | 6% | 1.5% |
| Combined | 65% | Company X | Not applicable | 4.7% |
On the surface, Company X might look like an 8 percent position in one fund and a 6 percent position in another. In your actual portfolio, it is a 4.7 percent position. That may be fine, but it should be intentional.
Now repeat this across your top holdings. You may discover that your top 10 real exposures are very different from what your brokerage account suggests.
Use weighted overlap, not just shared names
Name overlap counts how many holdings two funds share. Weighted overlap estimates how much of the funds are effectively duplicating each other.
A common way to calculate weighted overlap between two funds is:
Weighted overlap = sum of the smaller weight for each shared holding
Here is a simplified example:
| Holding | Fund A weight | Fund B weight | Smaller shared weight |
|---|---|---|---|
| Company X | 8% | 6% | 6% |
| Company Y | 5% | 3% | 3% |
| Company Z | 2% | 4% | 2% |
| Total overlap | Not applicable | Not applicable | 11% |
In this example, the weighted overlap is 11 percent. That does not mean the funds are 89 percent diversified from each other in a risk sense. It only means 11 percent of their holdings by weight are directly duplicated based on the securities shown.
A rough interpretation can help, as long as you treat it as a guide rather than a rule:
| Weighted overlap | What it may suggest | What to check next |
|---|---|---|
| Less than 10% | Low direct duplication | Check factor, sector, and correlation overlap |
| 10% to 30% | Moderate duplication | Review whether overlap is intentional |
| More than 30% | High duplication | Consider whether both funds are needed |
| More than 50% | Very high duplication | Compare fees, tax impact, and role in the portfolio |
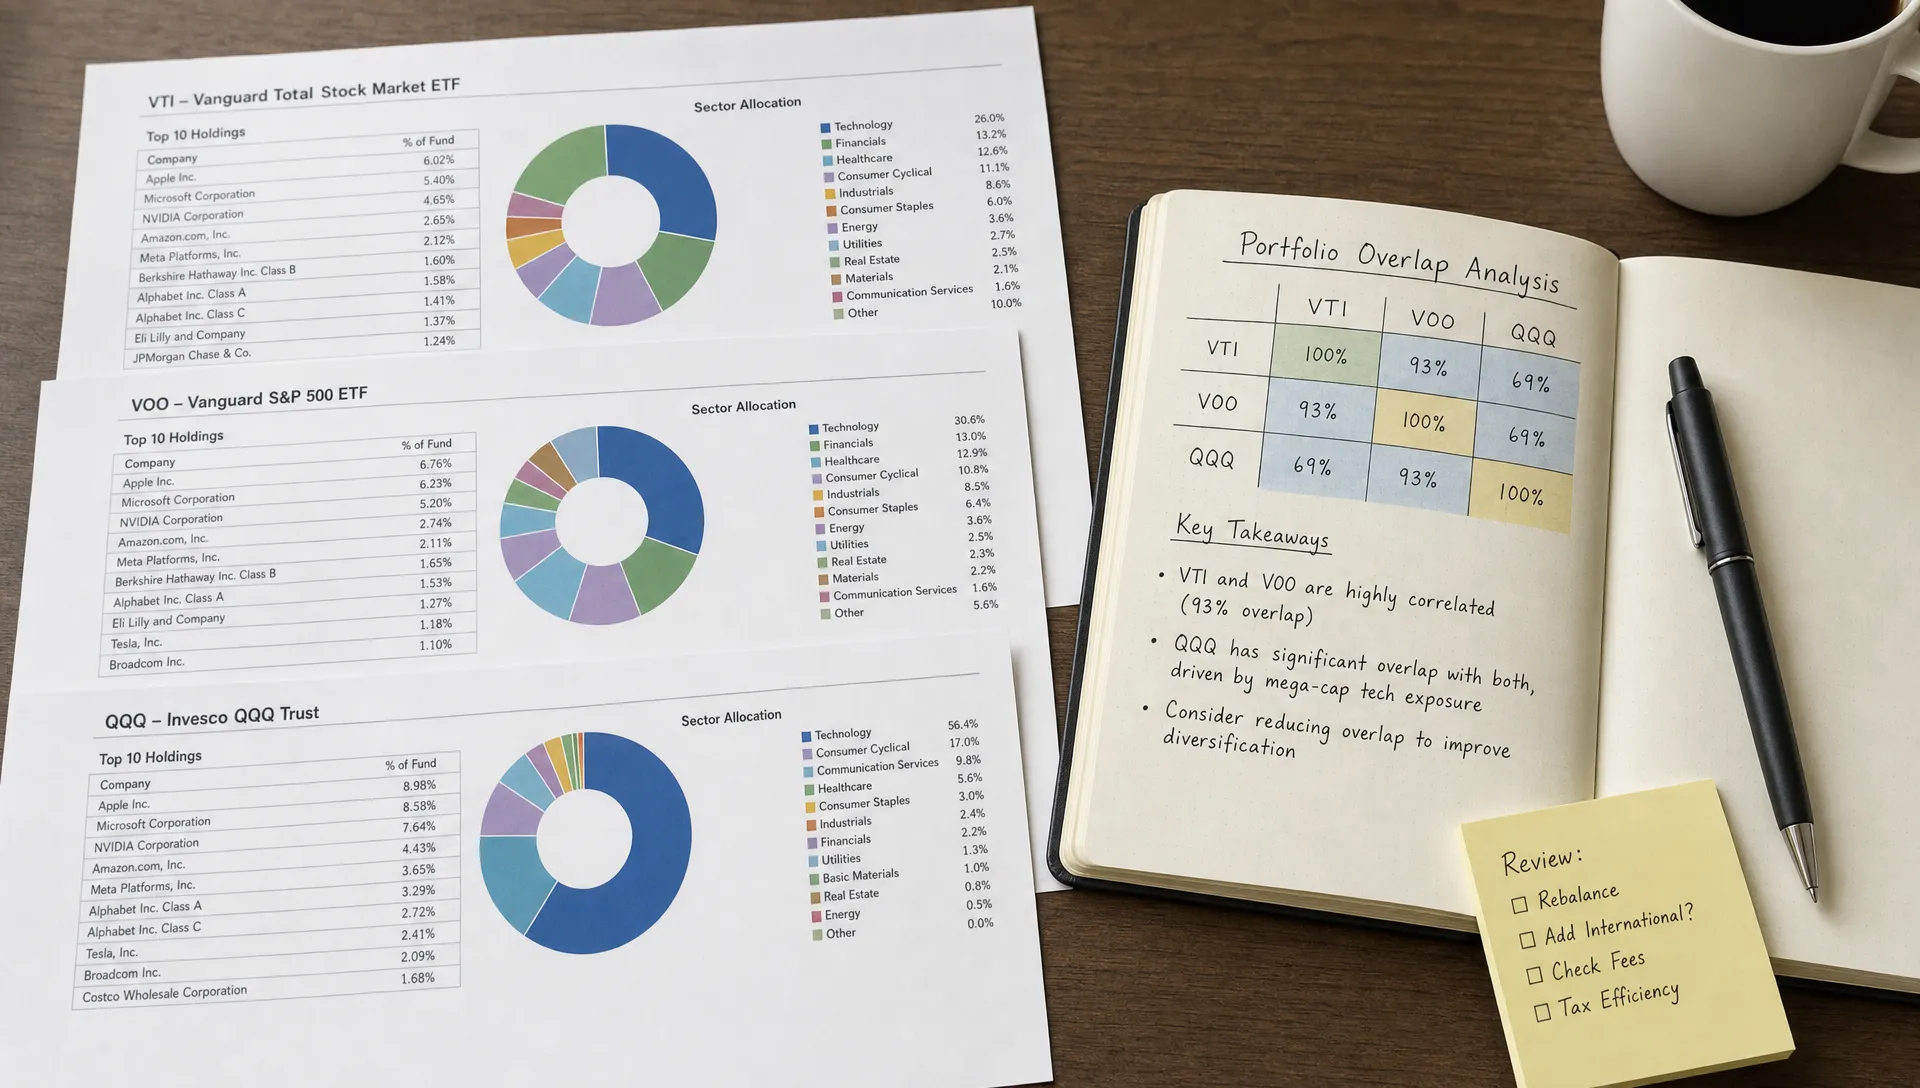
These ranges are not universal. A total market ETF and an S&P 500 ETF will naturally overlap heavily. That may be acceptable if you are deliberately tilting toward large US companies. But if you added both because they sounded different, the overlap may be unnecessary complexity.
Look for risk overlap that holdings do not reveal
Holdings overlap is only the first pass. Risk overlap is where many investors miss the real issue.
Imagine two funds with very little direct holdings overlap. One owns US software companies, and the other owns global internet platforms. They may not share many names, but both could be exposed to the same valuation pressure if interest rates rise or investors rotate away from growth stocks.
The same is true in fixed income. Two bond funds can hold different securities but still have similar duration, credit quality, or inflation sensitivity. If both funds are long-duration, they may fall together when rates rise. If both are exposed to lower-quality credit, they may struggle together during credit stress.
When comparing fund overlap, review these risk dimensions:
- Sector and industry exposure: Are multiple funds leaning into the same business cycle?
- Market cap exposure: Are you more concentrated in mega-cap, mid-cap, or small-cap names than you think?
- Style exposure: Are your funds all tilted toward growth, value, quality, dividends, or momentum?
- Geographic exposure: Does a global label still result in heavy US exposure?
- Currency exposure: Are international holdings hedged or unhedged?
- Rate and credit exposure: For bond funds, what are the duration, yield source, and credit risks?
- Liquidity exposure: Would underlying assets be hard to sell in stressed markets?
This is where fund overlap becomes more than a spreadsheet exercise. Your goal is to understand what would hurt the portfolio, not simply what tickers appear twice.
Compare funds against the role they are supposed to play
A fund should earn its place in your portfolio. To decide whether overlap is acceptable, define the role of each fund before judging the data.
A fund might serve as:
- A core market exposure
- A sector or theme tilt
- A defensive allocation
- An income source
- A diversifier against equity risk
- A tactical position
- A long-term factor exposure
Overlap is more concerning when two funds are supposed to play different roles but behave similarly. For example, if your defensive dividend fund has high overlap with your broad large-cap fund and still falls during the same market stress, it may not be providing the diversification you expected.
Overlap is less concerning when the role is explicit. If you own a broad index fund and add a semiconductor ETF because you want a deliberate semiconductor tilt, overlap with large technology holdings is part of the decision. The key is that the extra exposure should be visible and sized appropriately.
A useful question is: If this fund disappeared from my portfolio, what exposure would I actually lose?
If the answer is "not much," the fund may be redundant. If the answer is a specific exposure you want, the overlap may be justified.
Check overlap against your benchmark
Overlap analysis is incomplete without a benchmark. A 7 percent exposure to one company may be high for one strategy and normal for another. A 35 percent technology allocation may be aggressive relative to a balanced benchmark but normal for a growth-focused portfolio.
Choose a benchmark that reflects your actual objective, not the fund you happen to own. A retirement account with stocks and bonds should not be judged only against the Nasdaq 100. A global portfolio should not be judged only against the S&P 500. A sector-heavy strategy should be compared against both a broad market benchmark and the targeted sector exposure.
Once you have a benchmark, compare:
- Top holdings versus benchmark top holdings
- Sector weights versus benchmark sector weights
- Country weights versus benchmark country weights
- Growth and value exposure versus benchmark style
- Bond duration and credit quality versus benchmark fixed income exposure
This is also where real investor data can add context. With Upside Invest, users can benchmark a portfolio against verified investors rather than relying only on broad indices. That can help you see whether your overlap is common among similar investors or unusually concentrated.
Do not ignore correlation
Correlation is not the same as overlap, but it is a necessary companion.
Two funds can have high holdings overlap and high correlation. That is straightforward. But two funds can also have low holdings overlap and high correlation because they react to the same market forces.
Correlation can help answer questions such as:
- Do these funds rise and fall together?
- Did they diversify each other during past drawdowns?
- Are they exposed to the same macro variables?
- Does one fund reduce volatility, or does it only add another line item?
Be careful with short lookback periods. A fund pair may look uncorrelated during calm markets and become highly correlated during stress. This is especially important for strategies that depend on liquidity, leverage, credit spreads, or crowded trades.
Use correlation as a behavior check, not as a replacement for holdings analysis. Holdings tell you what you own. Correlation tells you how those assets have behaved together. You need both.
Watch for fund wrappers that hide duplication
Some fund structures make overlap harder to see.
Funds of funds are the obvious example. A balanced allocation ETF may hold several underlying stock and bond ETFs. If you also own those same ETFs directly, your real exposure may be higher than expected. A target date fund can create the same issue because it may already contain broad US equity, international equity, and fixed income exposure.
Multi-manager funds can also hide style overlap. The fund may use several managers, but if those managers all favor similar stocks or factors, the portfolio may be less diversified than the manager count suggests.
Thematic funds require special attention too. Funds with different labels, such as artificial intelligence, cloud computing, automation, or digital infrastructure, may share many of the same beneficiaries. The names sound different, but the holdings can cluster around the same large companies.
This is one reason process matters. A good overlap review should be repeatable, fast, and transparent. In other industries, tools such as modern event ticketing platforms reduce operational friction by giving organizers real-time control and clear workflows. Investors need the same principle in portfolio analysis: less friction, clearer data, and fewer hidden moving parts.
Decide what to do with the overlap
Once you find overlap, do not rush to eliminate it. First decide whether it supports your strategy.
There are four common actions:
| Finding | Possible action | Reasoning |
|---|---|---|
| Overlap is accidental and large | Consolidate or reduce one fund | Simplifies the portfolio and lowers unintended concentration |
| Overlap is intentional but too large | Rebalance position sizes | Keeps the tilt while controlling risk |
| Overlap is low but correlation is high | Add a different diversifier | The funds may share macro or factor risk |
| Overlap is justified by role | Keep and monitor | Some duplication is acceptable when it serves a clear purpose |
Costs and taxes matter here. Selling a fund in a taxable account can trigger capital gains. Replacing one fund with another can also create wash sale or tracking issues depending on what you sell and buy. If tax consequences are meaningful, consider adjusting future contributions, dividends, or rebalancing bands before making abrupt changes.
You should also compare fees. If two funds are very similar, the lower-cost and more tax-efficient option may deserve priority. But cost is not the only factor. Liquidity, tracking error, strategy quality, distribution needs, and account type can all matter.
For growth-oriented investors, overlap should also be evaluated against expected reward. A concentrated tilt may be reasonable if you understand the source of potential upside and the downside tradeoff. The key is to measure investment upside with better context, not simply chase the fund with the strongest recent chart.
A practical fund overlap checklist
Use this checklist whenever you add a new fund or review an existing portfolio:
- Identify the fund's role before looking at performance.
- Pull the latest available holdings and weights.
- Calculate your total portfolio exposure to repeated holdings.
- Compare weighted overlap, not just the number of shared names.
- Review sector, geography, factor, duration, and credit exposure.
- Compare the combined portfolio against a relevant benchmark.
- Check whether similar funds have high historical correlation.
- Decide whether overlap is intentional, excessive, or redundant.
- Consider taxes, fees, and account type before making changes.
- Repeat the analysis after major market moves or fund strategy changes.
A fund overlap review does not need to be perfect to be useful. Even a simple analysis of your top 25 combined holdings can reveal risks that a brokerage dashboard may not show.
Common mistakes when comparing fund overlap
The first mistake is comparing only top 10 holdings. Top holdings matter, but some funds have meaningful exposure spread across dozens of names. Sector and factor overlap may sit outside the top 10.
The second mistake is trusting fund names too much. A "dividend" fund, "quality" fund, and "large-cap core" fund can share many holdings. A "global" fund may still be heavily weighted to US stocks.
The third mistake is assuming that more funds means more diversification. More funds can create more diversification, but only if the exposures are truly different. Otherwise, more funds can simply make risk harder to see.
The fourth mistake is ignoring changes over time. Active funds can rotate. Index methodologies can change. A thematic fund can become more concentrated as winners grow. Your overlap analysis should be updated periodically, especially after strong market moves.
The fifth mistake is focusing only on upside. Overlap tends to feel good when shared holdings are rising. It becomes a problem when the same holdings reverse together. A portfolio that looks diversified during a bull market may reveal its true concentration during a drawdown.
Frequently Asked Questions
What does it mean to compare funds overlap? It means reviewing two or more funds to see where their holdings, weights, sectors, factors, and risk exposures duplicate each other. The goal is to understand whether your portfolio is truly diversified or simply holding similar assets through different wrappers.
Is fund overlap always bad? No. Fund overlap can be useful when it reflects an intentional tilt, such as adding more exposure to a sector or style you believe in. It becomes risky when you do not realize how concentrated your total exposure has become.
What is a good fund overlap percentage? There is no universal good percentage. Low overlap can still hide similar factor risk, while high overlap can be acceptable for a deliberate core and tilt strategy. Weighted overlap above 30 percent deserves closer review, but context matters.
Can two funds have low holdings overlap but still be risky together? Yes. Funds can hold different securities but still respond to the same drivers, such as interest rates, credit spreads, technology valuations, commodity prices, or market liquidity. That is why correlation and exposure analysis matter.
How often should I review fund overlap? Many long-term investors can review overlap quarterly or semiannually. You may want to review sooner after adding a new fund, making a large contribution, changing strategy, or seeing a major market move that changes position weights.
Make fund overlap visible before it becomes a risk
Comparing fund overlap is not about building the most complicated spreadsheet. It is about making sure your portfolio reflects the risks you actually want to take.
Start with holdings, calculate your real portfolio exposure, compare weighted overlap, and then look deeper at sectors, factors, geography, duration, credit, and correlation. The combination will give you a much clearer picture than fund names or past performance alone.
If you want a more data-driven way to understand what you own, Upside Invest helps investors compare portfolios, see verified investor holdings, track trends, and benchmark allocations while keeping profiles private and anonymous. Fund overlap is easier to manage when you can see your exposures clearly and compare them with real portfolio data.