How to Measure Investment Upside With Better Context
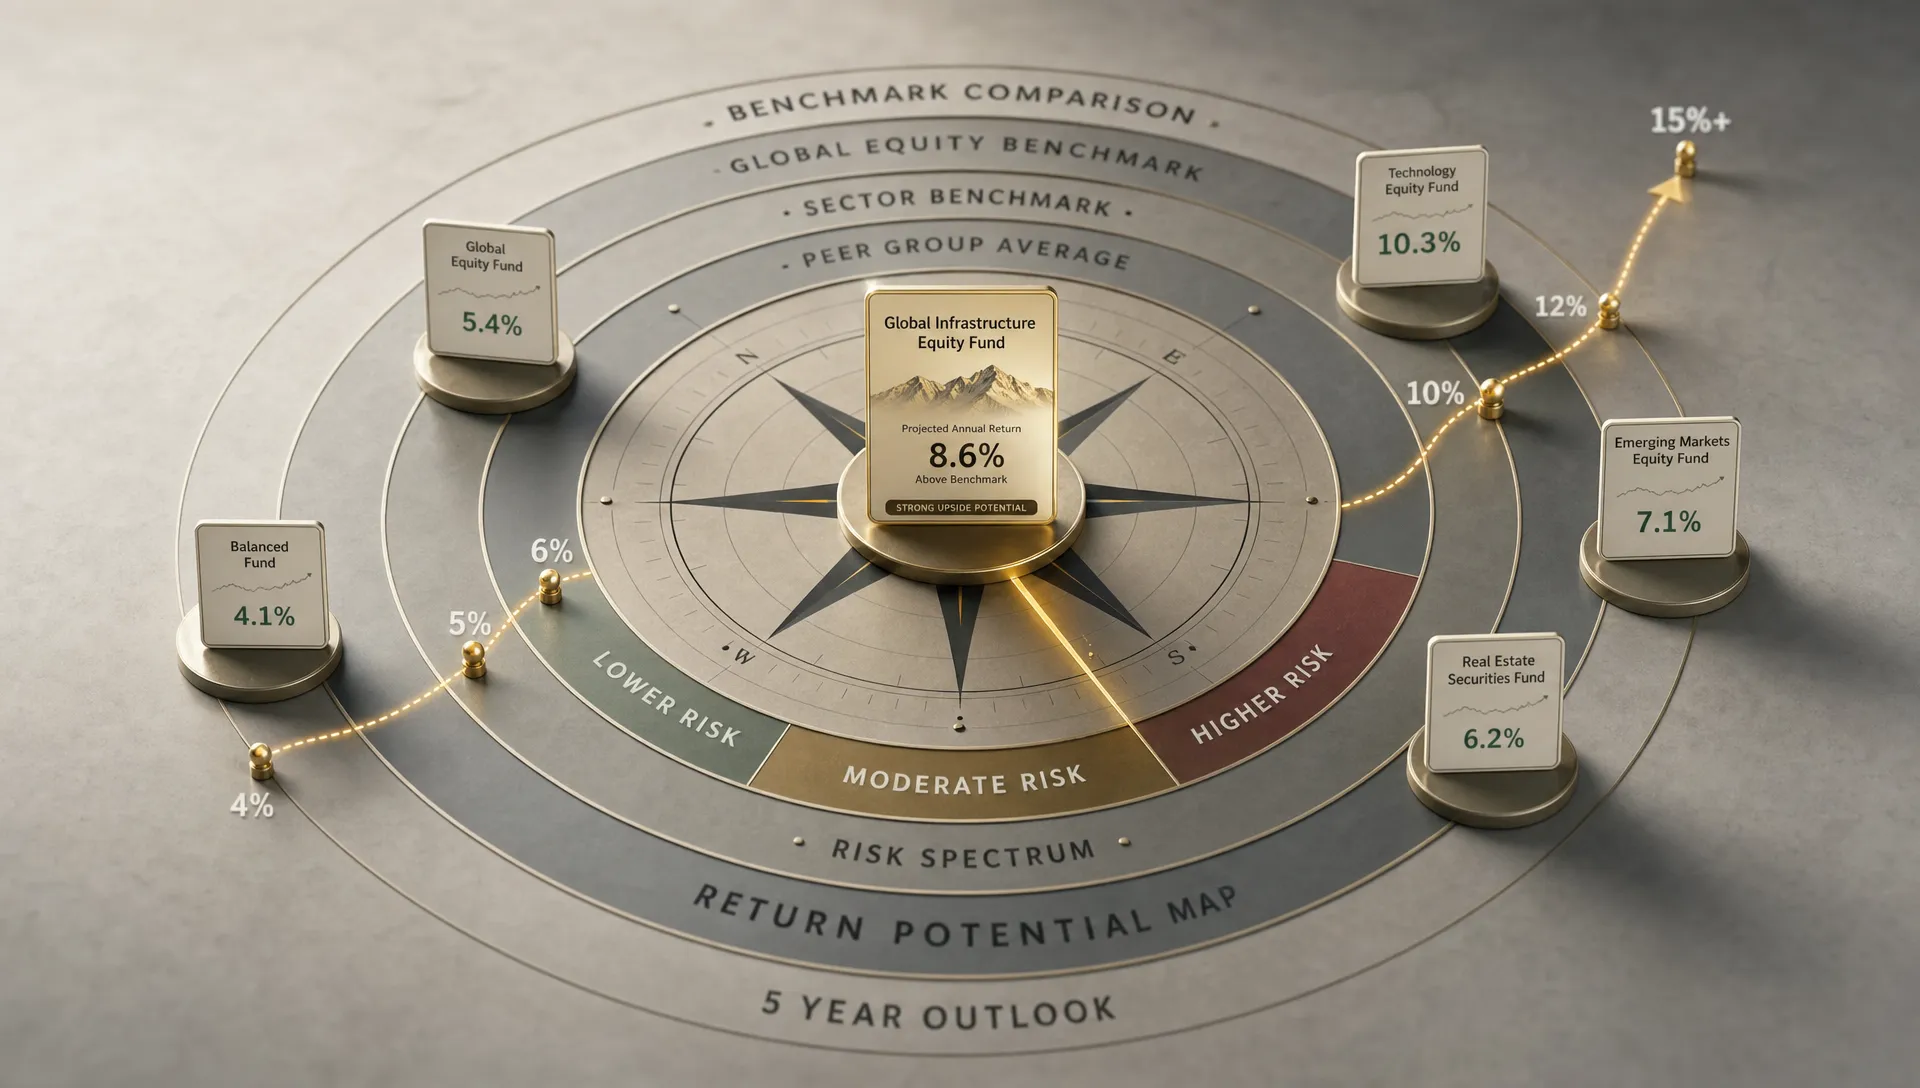
Most investors talk about upside as if it were a single number: a stock is 30% undervalued, a fund could double, a crypto asset has 10x potential. That simplicity is appealing, but it can also be misleading. Investment upside only becomes useful when it is measured with context: compared against the right benchmark, adjusted for risk, tied to a time horizon, and evaluated inside your actual portfolio.
Without that context, upside is just optimism with a spreadsheet attached.
A better approach is to ask not only how much an investment could rise, but why it might rise, what has to happen first, what could go wrong, and whether the opportunity is attractive relative to alternatives. This is the difference between chasing potential and making a disciplined allocation decision.
What investment upside really measures
At its simplest, investment upside is the potential gain between an asset's current price and a reasonable estimate of its future value. The basic formula looks like this:
| Component | Meaning |
|---|---|
| Current price | What you pay today |
| Estimated future value | What the asset could reasonably be worth later |
| Income or distributions | Dividends, interest, staking rewards, or fund distributions, if applicable |
| Expected upside | Future value plus income, minus current price, divided by current price |
That formula is a starting point, not a conclusion. A stock with 50% theoretical upside is not automatically better than a fund with 12% expected upside. The stock may rely on aggressive assumptions, face dilution risk, or require a five-year holding period with heavy volatility. The fund may offer lower upside but higher diversification, better liquidity, and a smoother path.
The more useful question is: what is the quality of the upside?
High-quality upside is supported by identifiable drivers, reasonable assumptions, favorable risk-reward, and a role that makes sense inside your portfolio. Low-quality upside depends on everything going right, ignores downside, or looks attractive only because it is compared to the wrong alternative.
Start with the source of upside
Before estimating potential return, identify what would actually create it. Different assets generate upside in different ways.
For an individual stock, upside may come from revenue growth, margin expansion, multiple re-rating, dividends, buybacks, or a change in market perception. For an ETF or mutual fund, it may come from factor exposure, sector rotation, valuation recovery, or broad market growth. For crypto, upside may depend on adoption, network activity, liquidity, token economics, or macro risk appetite.
A clear upside thesis should answer three questions:
- What has to improve for the asset to be worth more?
- How likely is that improvement, and over what time period?
- What evidence would show the thesis is working or failing?
If you cannot identify the source of potential return, you are probably measuring price movement, not investment upside.
For example, saying a stock can rise because it is down 40% from its high is not a thesis. Saying it can rise because free cash flow is recovering, debt is declining, and peers trade at higher multiples is closer to a thesis. The second version can be tested, compared, and revised.
Compare against the right benchmark
Upside is relative. A 15% expected return may be attractive in one context and weak in another. That is why benchmark selection matters.
Many retail investors default to the S&P 500, but that benchmark is not always appropriate. A small-cap ETF, emerging market stock, high-yield bond fund, and crypto asset all carry different risks. Measuring each against a large-cap US equity index can distort the opportunity.
A better benchmark reflects what you would realistically own instead. If you are evaluating a global equity ETF, compare it with other global equity options. If you are evaluating a single growth stock, compare it with similar companies, a relevant sector ETF, and the broader market. If you are deciding whether to hold cash, compare expected upside against Treasury yields, money market returns, inflation, and your liquidity needs.
| Investment type | Better comparison set | Context to add |
|---|---|---|
| Large-cap stock | Sector peers, index alternatives, quality factors | Valuation, margins, growth durability |
| Small-cap stock | Small-cap index, similar market-cap peers | Liquidity, balance sheet strength, cyclicality |
| ETF or fund | Category peers, underlying holdings, expense ratio | Factor exposure, overlap, diversification |
| Crypto asset | Network peers, liquidity, risk assets | Adoption, volatility, token supply |
| Cash or short-term bonds | Savings yields, Treasuries, near-term needs | Safety, flexibility, reinvestment opportunity |
This is where portfolio benchmarking becomes more practical than simply asking whether an investment can go up. Seeing how your allocation compares with other investors can expose whether you are truly differentiated or simply taking a common risk in a different wrapper. Upside Invest's guide on how to benchmark your portfolio against verified investors covers this idea in more detail.
Adjust upside for risk, probability, and path
A target price is not a probability. If an analyst, investor, or model suggests a stock has 40% upside, that figure usually represents one scenario, not the full range of possible outcomes.
A more grounded approach is scenario analysis. Instead of asking what the asset could be worth in the best case, estimate several outcomes and assign rough probabilities. The goal is not precision. The goal is to avoid treating the bull case as the base case.
| Scenario | Probability | Return outcome | Weighted contribution |
|---|---|---|---|
| Bull case | 25% | +60% | +15.0% |
| Base case | 50% | +18% | +9.0% |
| Bear case | 25% | -30% | -7.5% |
| Estimated expected return | 100% | +16.5% |
In this hypothetical example, the headline upside might be 60%, but the probability-weighted expected return is 16.5%. That is still attractive, but it tells a very different story.
Risk context also includes volatility, drawdown potential, liquidity, concentration, and correlation with what you already own. A position with strong standalone upside may still be a poor addition if it increases exposure to the same factor already dominating your portfolio. For example, adding another AI infrastructure stock may look diversified by ticker, but not by economic driver.
That is why portfolio-level analysis matters. A good investment can become a bad allocation if it magnifies hidden risk. If you want to go deeper on this, Upside Invest's article on how portfolio comparison can reveal hidden risk is a useful companion framework.
Include time horizon and opportunity cost
Upside without a time horizon is incomplete. A potential 40% gain over one year is very different from a potential 40% gain over seven years.
Annualizing the expected return helps you compare opportunities more honestly. If an investment could return 50% over five years, the annualized return is much lower than the headline number suggests. That does not make it unattractive, but it changes the comparison.
Time horizon also affects liquidity. If you may need capital for a home purchase, tuition, taxes, a business, or emergency reserves, a high-upside investment may be unsuitable even if the thesis is sound. Capital that must be available soon should not be evaluated the same way as long-term risk capital.
This is especially important when investments compete with major financial decisions. For example, if your portfolio capital may affect a purchase, refinance, or home equity plan, reviewing personalized mortgage solutions can help clarify whether keeping funds liquid has more value than pursuing additional market upside.
Opportunity cost is not just what another stock might return. It is the best alternative use of your money, adjusted for risk, timing, taxes, and personal goals.
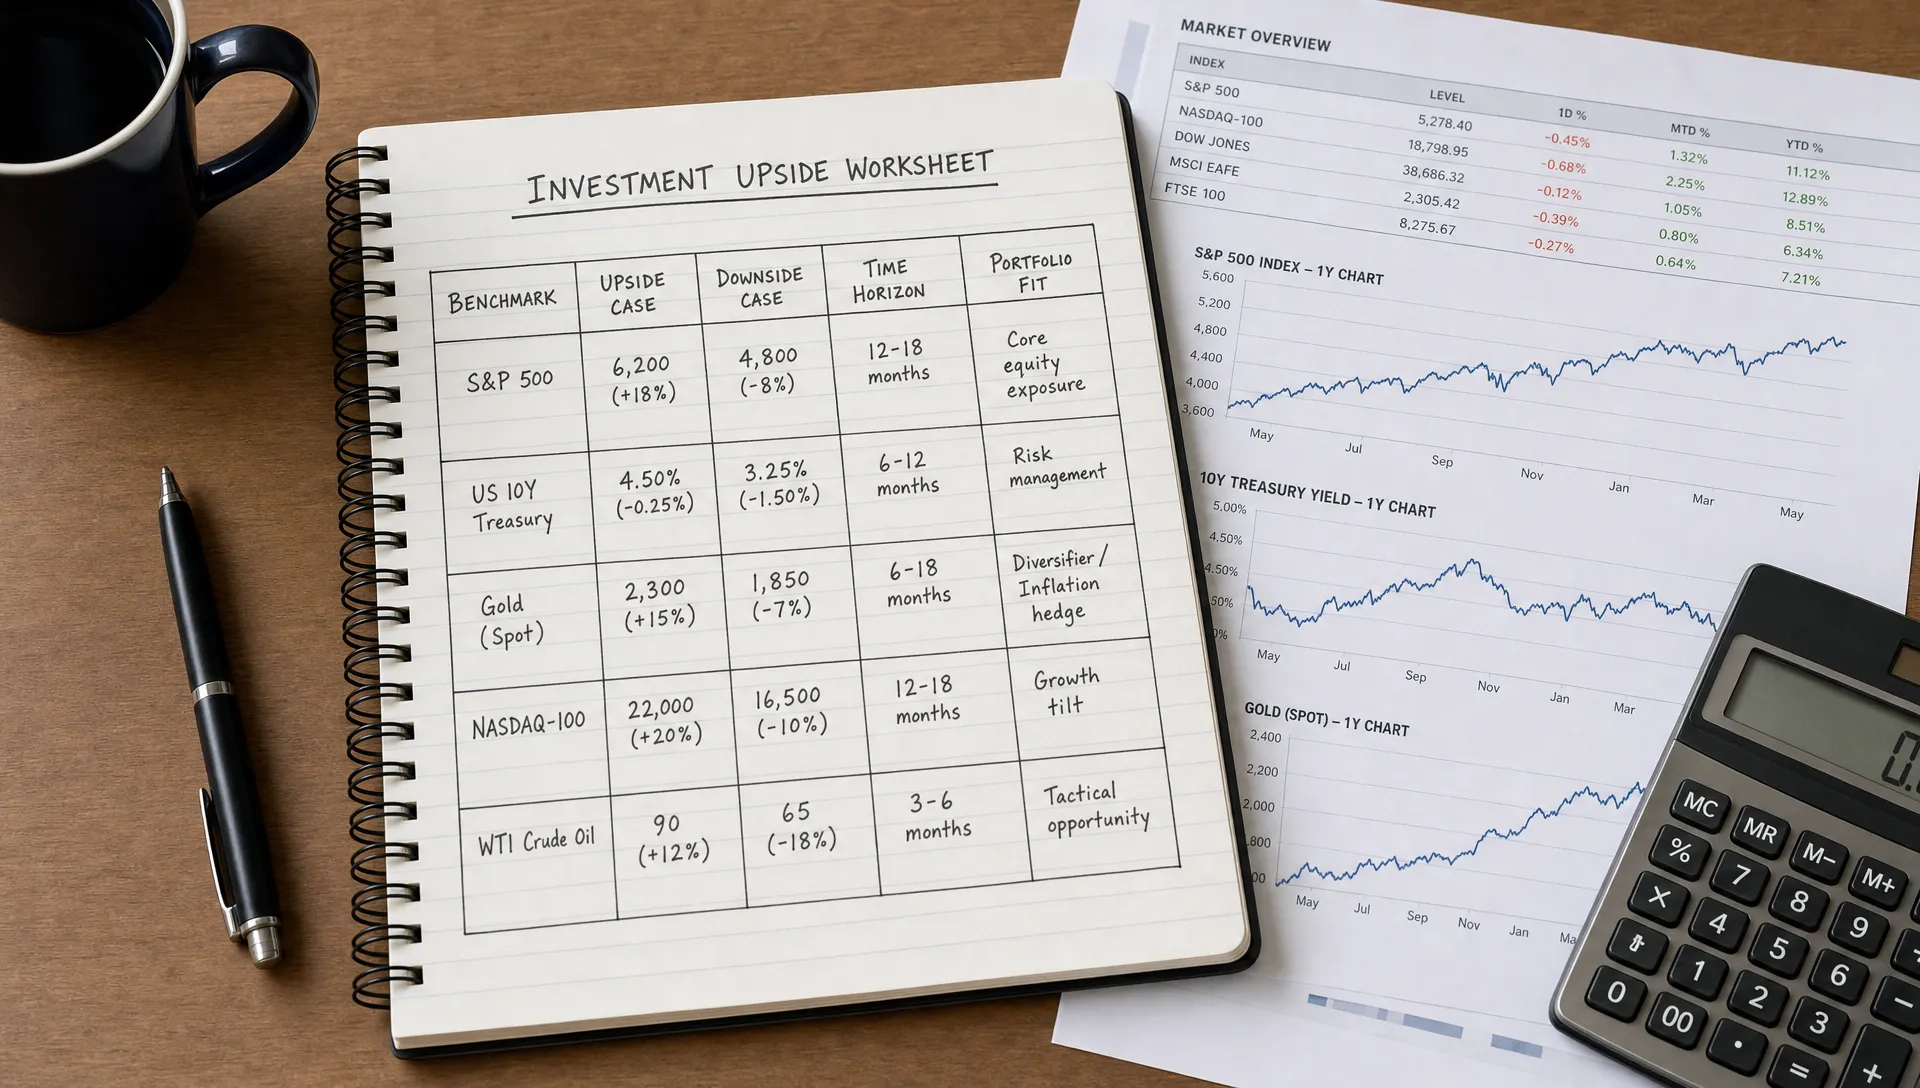
Add ownership and investor behavior context
Markets are driven by expectations, positioning, and flows. That does not mean you should blindly follow other investors, but ownership data can add useful context to an upside estimate.
If an asset is already crowded among similar investors, upside may depend on continued enthusiasm. If strong performers are accumulating an overlooked asset, it may indicate that the market is starting to recognize a thesis. If holders are reducing exposure despite a strong narrative, it may be worth asking what risk they see.
Useful behavior signals include changes in ownership, concentration among holders, overlap with other popular positions, and whether investors with strong risk-adjusted returns are increasing or decreasing exposure. These signals do not replace fundamental analysis, but they can challenge your assumptions.
For individual stocks, traditional ownership data can also reveal important context. Insider ownership, institutional flows, short interest, and float can all affect how upside plays out. Upside Invest has a separate breakdown of stock ownership data investors should track if you want to connect those signals to your research process.
Build an investment upside context stack
A practical way to measure investment upside is to build a repeatable context stack. This turns a vague idea into a structured decision.
| Context layer | Key question | Why it matters |
|---|---|---|
| Thesis | What specifically creates upside? | Separates analysis from hope |
| Valuation | What assumptions are already priced in? | Prevents paying too much for growth |
| Benchmark | What is the realistic alternative? | Makes return comparisons fair |
| Risk | What could cause permanent or temporary loss? | Shows whether upside is worth the downside |
| Probability | How likely are each of the main outcomes? | Avoids over-weighting the bull case |
| Time horizon | How long might the thesis take? | Converts headline upside into annualized return |
| Portfolio fit | Does this improve or duplicate your exposure? | Measures allocation value, not just asset value |
| Investor behavior | What are verified investors doing? | Adds positioning and sentiment context |
This stack is useful because it forces consistency. You can apply it to a stock, ETF, fund, or crypto asset without pretending every asset is analyzed the same way. The inputs change, but the questions remain stable.
The stack also helps you avoid one of the most common retail investing mistakes: evaluating each investment in isolation. Upside is not only about whether a single asset can rise. It is about whether adding that asset improves your total portfolio's expected outcome.
Common mistakes when measuring investment upside
The first mistake is confusing upside with certainty. A higher possible return usually comes with a wider range of outcomes. If your analysis has no bear case, it is not measuring risk.
The second mistake is ignoring dilution, fees, taxes, and distributions. A company may grow, but shareholders may not capture the full benefit if share count rises significantly. A fund may perform well before fees but lag after expenses. A taxable gain may be less attractive than a lower-return alternative held in a more efficient account.
The third mistake is using stale assumptions. Upside changes when price changes. A stock that had 35% upside after a selloff may have much less after a fast rally, even if the company is still excellent. Re-underwriting matters.
The fourth mistake is copying another investor's position without copying their context. Their cost basis, tax situation, time horizon, risk tolerance, and portfolio exposures may be completely different from yours.
The fifth mistake is treating popularity as proof. Crowded trades can keep working, but they can also unwind quickly when expectations shift. Popularity is a signal to investigate, not a reason to suspend judgment.
How Upside Invest adds better context
Upside Invest is built around a simple idea: investors can make better decisions when they can compare their portfolios with real, verified investor data while maintaining privacy. Instead of relying only on headlines, social posts, or broad index comparisons, users can see what verified investors are buying, holding, and outperforming with.
That context can make upside analysis more grounded. Portfolio comparison tools can help you see whether a new idea diversifies your exposure or doubles down on an existing theme. Trend and momentum tracking can show whether investor interest is building or fading. Top performer rankings, return metrics, Sharpe metrics, alerts on investor moves, and sector or theme discovery can all add perspective before you commit capital.
None of this removes the need for independent judgment. Upside data should not turn investing into imitation. Its value is in helping you ask better questions: Why do top performers hold this? Is my allocation unusually concentrated? Am I missing a theme others are finding? Is this opportunity still attractive after adjusting for risk and time?
That is the kind of context that turns investment upside from a guess into a decision framework.
Frequently Asked Questions
What is investment upside? Investment upside is the potential gain between an asset's current price and a reasonable estimate of its future value, including any income or distributions. The most useful upside estimates also account for risk, probability, time horizon, and portfolio fit.
How do you calculate investment upside? A simple calculation is future estimated value plus expected income, minus current price, divided by current price. For better context, compare that result with a relevant benchmark and use scenario analysis to estimate probability-weighted returns.
Why is benchmark context important? Benchmark context helps you decide whether an expected return is attractive relative to realistic alternatives. A small-cap stock, bond fund, global ETF, and crypto asset should not all be judged against the same benchmark.
Is higher upside always better? No. Higher upside often comes with higher uncertainty, volatility, liquidity risk, or downside potential. A lower-upside investment may be better if it has stronger probability, better diversification, or a more reliable return path.
How can investor behavior help measure upside? Verified investor behavior can show whether other investors are accumulating, holding, or reducing exposure to an asset. This does not prove an investment is good, but it can add useful context around conviction, crowding, and momentum.
Put upside in context before you invest
Measuring investment upside well is not about finding the biggest possible number. It is about understanding the full setup: the thesis, valuation, benchmark, downside, probability, time horizon, and portfolio impact.
Upside Invest helps retail investors bring that context into the decision process through anonymous verified portfolio data, comparison tools, trend tracking, and investor behavior insights. Before you add a position because it looks cheap or exciting, compare it against what you already own and what verified investors are actually doing.
The best upside is not just the highest potential return. It is the opportunity that improves your portfolio on purpose.