Compare Investment Portfolios Without Focusing Only on Returns
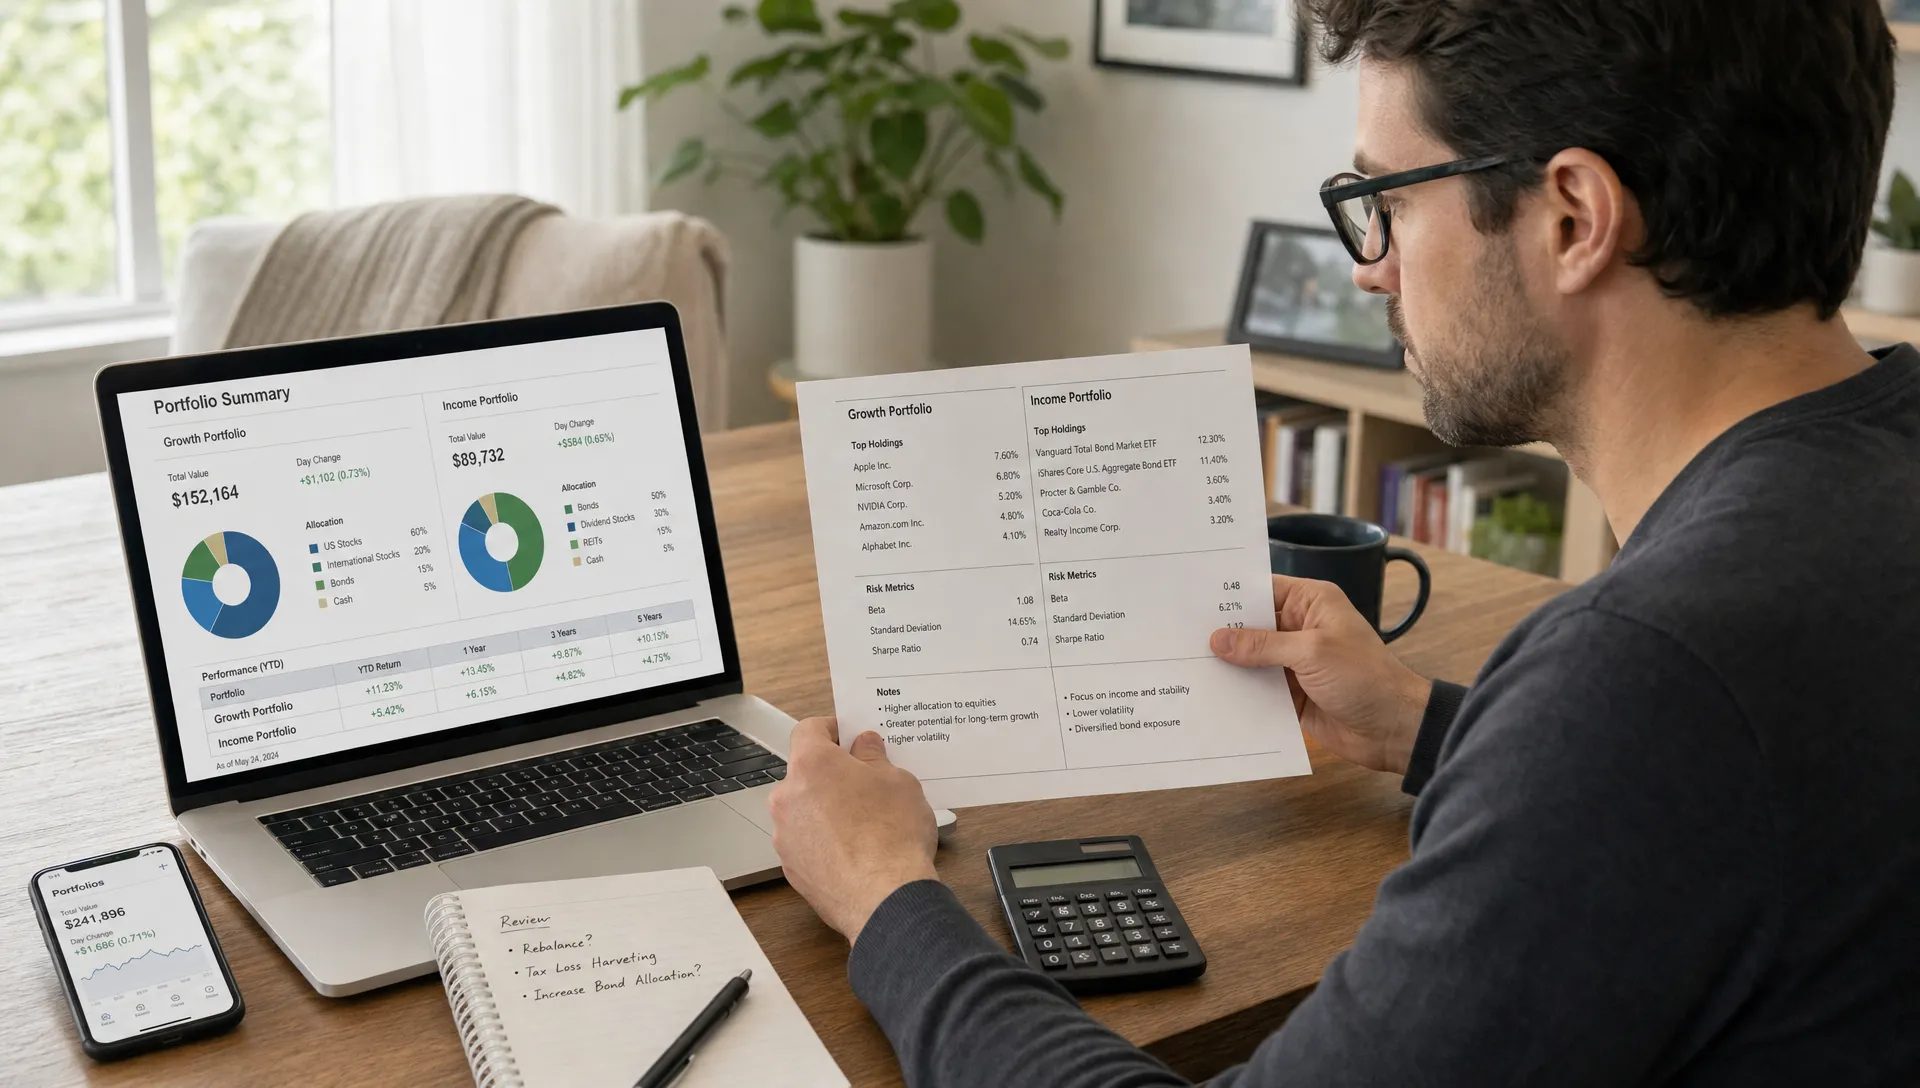
Comparing portfolios by return alone is tempting because it feels objective. One account is up 18 percent, another is up 9 percent, so the first investor must be doing something better. In reality, that simple comparison can reward lucky timing, hidden concentration and risk that may not fit your goals.
A better way to compare investment portfolios is to ask what produced the return, how much risk was taken, whether the result is repeatable and whether the strategy makes sense for your own time horizon. The point is not to ignore returns. The point is to place returns inside a fuller picture.
Why returns alone can mislead you
Returns are the headline number, but they rarely tell the full story. A portfolio can outperform for a year because it held one explosive stock, loaded up on a single sector or took large currency, leverage or crypto exposure. That may be impressive, but it is not always useful as a model.
The reverse is also true. A diversified portfolio can underperform during a narrow bull market and still be well built for long-term compounding. If you only rank investors by recent returns, you may end up copying the portfolio that benefited most from the last trend instead of the portfolio that is best designed for your needs.
The U.S. SEC's Investor.gov explains that risk and return are closely linked, meaning higher return potential generally comes with a greater chance of loss. That tradeoff is where portfolio comparison becomes useful.
| Return-only signal | What it might hide | Better comparison question |
|---|---|---|
| Highest 12-month return | Recent momentum, sector concentration or luck | What assets drove the return? |
| Strong long-term return | Large drawdowns along the way | Could I tolerate the worst period? |
| Similar return to my portfolio | Very different risk profile | Which portfolio used risk more efficiently? |
| Outperformance versus friends | Different goals, deposits or time horizons | Are we comparing the same objective? |
Start with the investor's objective
Before comparing two portfolios, define what each one is trying to do. A 28-year-old investor building wealth over decades should not be judged by the same criteria as someone preserving capital for a home purchase in three years. The right comparison starts with purpose.
Ask whether the portfolio is built for growth, income, capital preservation, inflation protection or speculation. Those labels are not cosmetic. They influence asset allocation, drawdown tolerance, position sizing and the kind of benchmark that makes sense.
A growth portfolio can look reckless beside a balanced portfolio during a selloff. A conservative portfolio can look weak during a speculative rally. Neither judgment is useful unless the objective is clear.
If you use benchmarks, make sure the benchmark actually matches the portfolio. A global stock and bond portfolio should not be judged only against the S&P 500. A concentrated technology portfolio should not be compared as if it were a broad market portfolio. For a deeper framework, Upside's guide on how to compare portfolio performance to a benchmark without bias breaks down the common mistakes that distort results.
Compare the risk taken to earn the return
Once objectives are aligned, risk becomes the next layer. Two portfolios can both earn 10 percent, but one may have taken a smooth path while the other fell 35 percent before recovering. Most investors care about that difference once it happens to them.
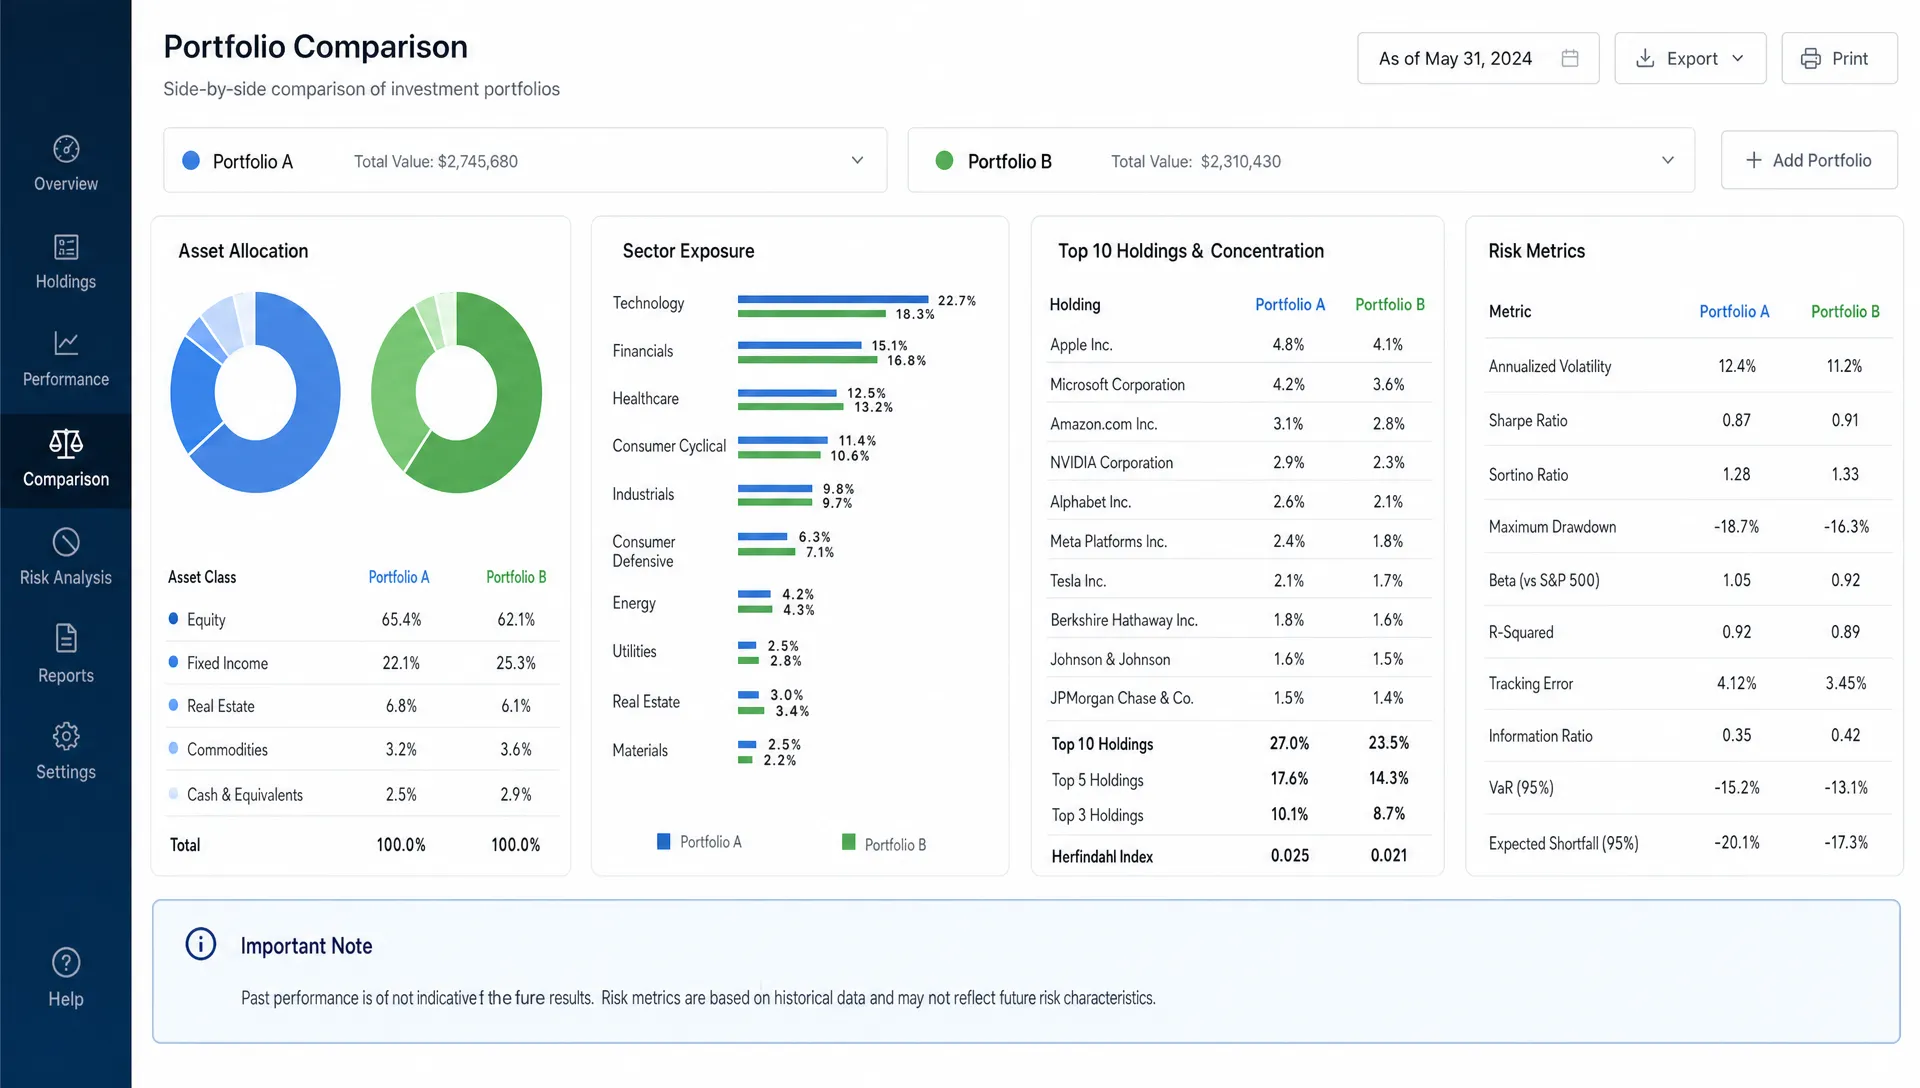
Useful risk metrics include volatility, maximum drawdown, beta and risk-adjusted return. Volatility shows how much returns fluctuate. Maximum drawdown shows the largest peak-to-trough decline. Beta estimates sensitivity to a market benchmark. Risk-adjusted measures, such as the Sharpe ratio, help compare return relative to the amount of volatility taken.
No single metric is perfect. A portfolio with low volatility can still hold hidden liquidity risk. A high Sharpe ratio over a short period may be driven by a market environment that will not repeat. But together, these measures help move the conversation from who made more to who was paid well for the risk they accepted.
| Metric | What it helps reveal | Why it matters |
|---|---|---|
| Volatility | How unstable returns were | Helps estimate emotional and financial stress |
| Maximum drawdown | Worst decline from a previous high | Shows the loss an investor had to endure |
| Beta | Sensitivity to a benchmark | Helps separate market exposure from unique bets |
| Sharpe ratio | Return relative to volatility | Helps compare efficiency, not just outcome |
| Cash allocation | Defensive positioning or dry powder | Explains why returns may lag or stabilize |
Look through the holdings, not just the labels
Portfolio labels can create false comfort. Two portfolios may both be described as diversified, but one could hold five ETFs that all own the same mega-cap stocks. Another might hold individual stocks across different sectors but still depend heavily on one economic theme, such as AI infrastructure, energy prices or interest rates.
This is why holdings-level comparison matters. You want to see the actual companies, funds, sectors, regions and asset classes behind the performance. A portfolio with 40 positions is not automatically diversified if the top five holdings dominate the results.
Overlap is especially important when comparing fund portfolios. An investor might own several broad market ETFs, sector ETFs and growth funds without realizing that the same companies appear repeatedly. That can create concentration without intention. Upside's article on portfolio comparison tips that reveal hidden risk explores this problem in more detail.
A good comparison should answer practical questions: how much is in stocks, bonds, cash, funds and crypto? Which sectors dominate? How much of the portfolio depends on a small number of positions? Are the holdings liquid enough for the investor's likely needs?
Separate skill from market environment
Strong performance may reflect skill, but it can also reflect the market environment. A portfolio tilted toward growth stocks will often shine when rates are falling and investors are willing to pay high valuations. A value or dividend portfolio may look better when markets favor profitability, cash flow and defensive balance sheets.
This does not make either approach right or wrong. It means you need to understand the driver. If a portfolio outperformed because it was exposed to a rewarded factor, such as momentum, quality, size or value, you should know that before treating the manager or investor as unusually skilled.
Time horizon matters here. A three-month leaderboard may be useful for spotting momentum, but it is weak evidence of repeatable decision-making. A multi-year record gives more context, especially if it includes different market conditions. Even then, the comparison should look at how returns were earned, not just where they ended.
One helpful exercise is to ask what would have hurt the portfolio. If the answer is a rate spike, oil crash, dollar move or crypto selloff, you have identified a dependency. That dependency may be acceptable, but it should be intentional.
Evaluate behavior, not only positions
A static snapshot tells you what an investor owns today. Behavior tells you how they make decisions. Did they rebalance after a rally? Add during a drawdown? Chase a crowded trade late? Hold cash with a purpose? Trim winners gradually or sell at the first sign of volatility?
Behavior is often the difference between a portfolio that looks good on paper and one an investor can actually follow. A strategy requiring constant monitoring, rapid trading and high conviction may not suit someone who wants a low-maintenance approach.
This is also where tools should support judgment rather than replace it. Outside investing, an AI-first recruitment platform like CandiDesk illustrates a useful pattern: software can screen, organize and schedule at scale, but humans still approve the important communication. Portfolio comparison works best the same way. Let technology surface patterns and risks, then make the decision yourself.
When comparing investor behavior, look for evidence of discipline. A portfolio that evolves consistently with a stated thesis may be more useful than one that jumps from trend to trend. Top performers can still make poor decisions, and underperformers can still have a sound process temporarily out of favor.
Use peer comparison carefully
Peer comparison can be powerful because it shows what real investors are doing, not just what a model portfolio suggests. But peer data must be interpreted carefully. Copying another investor without understanding their goals, risk tolerance, tax situation and cash flow needs can lead to bad decisions.
The best use of peer comparison is benchmarking, not blind imitation. If many verified investors with similar goals are reducing exposure to a theme you own heavily, that may be worth investigating. If top performers are concentrated in a sector you do not understand, the right response may be to learn, not to chase.
Upside Invest is built around this idea of context. The platform helps users compare portfolios against verified investors while keeping profiles private and anonymous. Features like verified holdings, portfolio comparison tools, trend tracking, top performer rankings, AI portfolio recommendations and risk metrics can help you see how your allocation differs from others without turning comparison into copy trading. You can learn more about the approach in Upside's guide to benchmarking your portfolio with verified investors.
A practical checklist for comparing portfolios
You do not need a complicated institutional process to compare portfolios well. You need a repeatable checklist that keeps you from overreacting to the return number.
Use these questions before deciding that one portfolio is better than another:
- What objective is the portfolio built for?
- Is the benchmark appropriate for its asset mix?
- What time period is being compared?
- How much volatility and drawdown came with the return?
- Which holdings, sectors or themes drove performance?
- How concentrated are the top positions?
- How much overlap exists across funds or ETFs?
- Did the investor show discipline during market stress?
- Would I be comfortable owning this portfolio during a bad year?
- Does this strategy fit my goals, taxes, liquidity needs and time horizon?
The last question is the most important. A portfolio can be excellent for someone else and wrong for you. Good comparison should sharpen your thinking, not pressure you into copying the latest winner.
Common mistakes to avoid
The biggest mistake is comparing different portfolios over different time frames. If one investor reports a year-to-date return and another reports a 12-month return, the numbers may not be comparable. Deposits, withdrawals and cash drag can also distort results if performance calculations are inconsistent.
Another mistake is ignoring taxes and trading costs. A high-turnover strategy may look attractive before taxes but less compelling after realized gains. This matters more in taxable accounts than in tax-advantaged accounts.
Investors also tend to overvalue recent performance. A portfolio that worked well in the last market regime can become fragile when conditions change. Rate-sensitive assets, speculative growth stocks, commodities, long-duration bonds and crypto can all behave differently when macro conditions shift.
Finally, avoid treating risk as a flaw by default. Risk is not automatically bad. Uncompensated risk is the problem. If you understand a risk, size it correctly and are paid for taking it, that can be part of a rational strategy.
Frequently Asked Questions
What is the best way to compare investment portfolios? The best way is to compare returns alongside objectives, benchmarks, volatility, drawdowns, asset allocation, holdings overlap, concentration and investor behavior. Returns matter, but they need context.
Why should I not focus only on returns? Returns can be driven by luck, leverage, timing or concentration. Without understanding the risk taken to earn them, you may copy a strategy that does not fit your goals or tolerance for losses.
What benchmark should I use when comparing portfolios? Use a benchmark that reflects the portfolio's actual asset mix. A U.S. stock benchmark may be inappropriate for a portfolio holding international stocks, bonds, cash, funds and crypto.
Is a higher Sharpe ratio always better? Not always. A higher Sharpe ratio can suggest more efficient risk-adjusted performance, but it depends on the time period, data quality and whether volatility captures the risks that matter.
Can I use other investors' portfolios to improve my own? Yes, if you use them as context rather than instructions. Verified peer portfolios can help you identify allocation differences, trends and risks, but your final decisions should match your own financial situation.
Compare portfolios with more context
Returns are only the starting point. The better question is whether a portfolio earned those returns in a way that is understandable, repeatable and appropriate for your goals.
With Upside Invest, you can compare your portfolio with verified investor holdings, explore trends, review risk and return metrics and learn from anonymous peer data while keeping your profile private. Use comparison to make better decisions, not to chase the highest recent return.