Countertrend Trading: When Reversals Are Worth the Risk

Countertrend trading means taking a position against the prevailing price trend, usually to capture a rebound or pullback before the larger move resumes. The attraction is an entry near a potential turning point. The danger is mistaking a temporary pause for an actual change in direction.
A reversal is worth considering only when there is evidence that the existing move is weakening, a clear price level that invalidates the trade and enough realistic upside to compensate for losses and execution costs. A price that simply looks stretched does not meet that standard.
A bounce is not the same as a lasting reversal
Start by naming the trend and its timeframe. Buying a rebound during a daily downtrend is a countertrend position on the daily chart, even if the five-minute chart has already turned upward. Without that distinction, almost any trade can be described as following some trend.
Three outcomes matter: a brief bounce, a retracement toward a reference level and a durable trend reversal. They require different holding periods and exit expectations. A trade targeting nearby resistance does not need to predict the next bull market.
Mean reversion is related but not identical. It describes movement back toward a reference, such as a moving average or trading-range midpoint. Trading against a trend describes your position relative to that trend. Sometimes both apply, but neither guarantees the reference remains economically meaningful.
If the prevailing move still has intact structure, compare the opportunity with risk-managed trend trading rather than assuming the opposite side offers better value.
When countertrend trading is worth considering
The strongest starting question is not whether price has moved too far. It is whether the conditions that supported the move are changing.
A range-bound market and a company undergoing a fundamental repricing can both produce extreme indicator readings. They should not receive the same response.
| Market condition | What it suggests | Practical response |
|---|---|---|
| Repeated range boundaries with failed breakouts | Price may continue rotating between established levels | Consider a confirmed rejection with a nearby invalidation point |
| Strong directional structure with shallow pullbacks | The trend remains persistent | Avoid fading strength or weakness solely because it looks extended |
| An extended move followed by a failed new high or low | Continuation may be losing traction | Wait for price to reclaim or reject a meaningful level |
| Earnings, financing stress or another material development | Prior valuation assumptions may no longer apply | Reassess the catalyst before relying on historical averages |
A favorable environment is still not an entry signal. An oversold stock can become more oversold, and a crowded rally can continue as new buyers arrive. The setup becomes more credible when an attempted continuation fails and price confirms that failure.
Require observable failure, not just an extreme indicator
For countertrend trading, an indicator should identify a candidate rather than authorize a position. An RSI reading below 30, for example, says something about recent price momentum under its calculation. It does not establish that selling has ended.
A more useful long setup combines several observable conditions:
- A defined location: Price reaches a previously identified support area, range boundary or other level selected before the bounce.
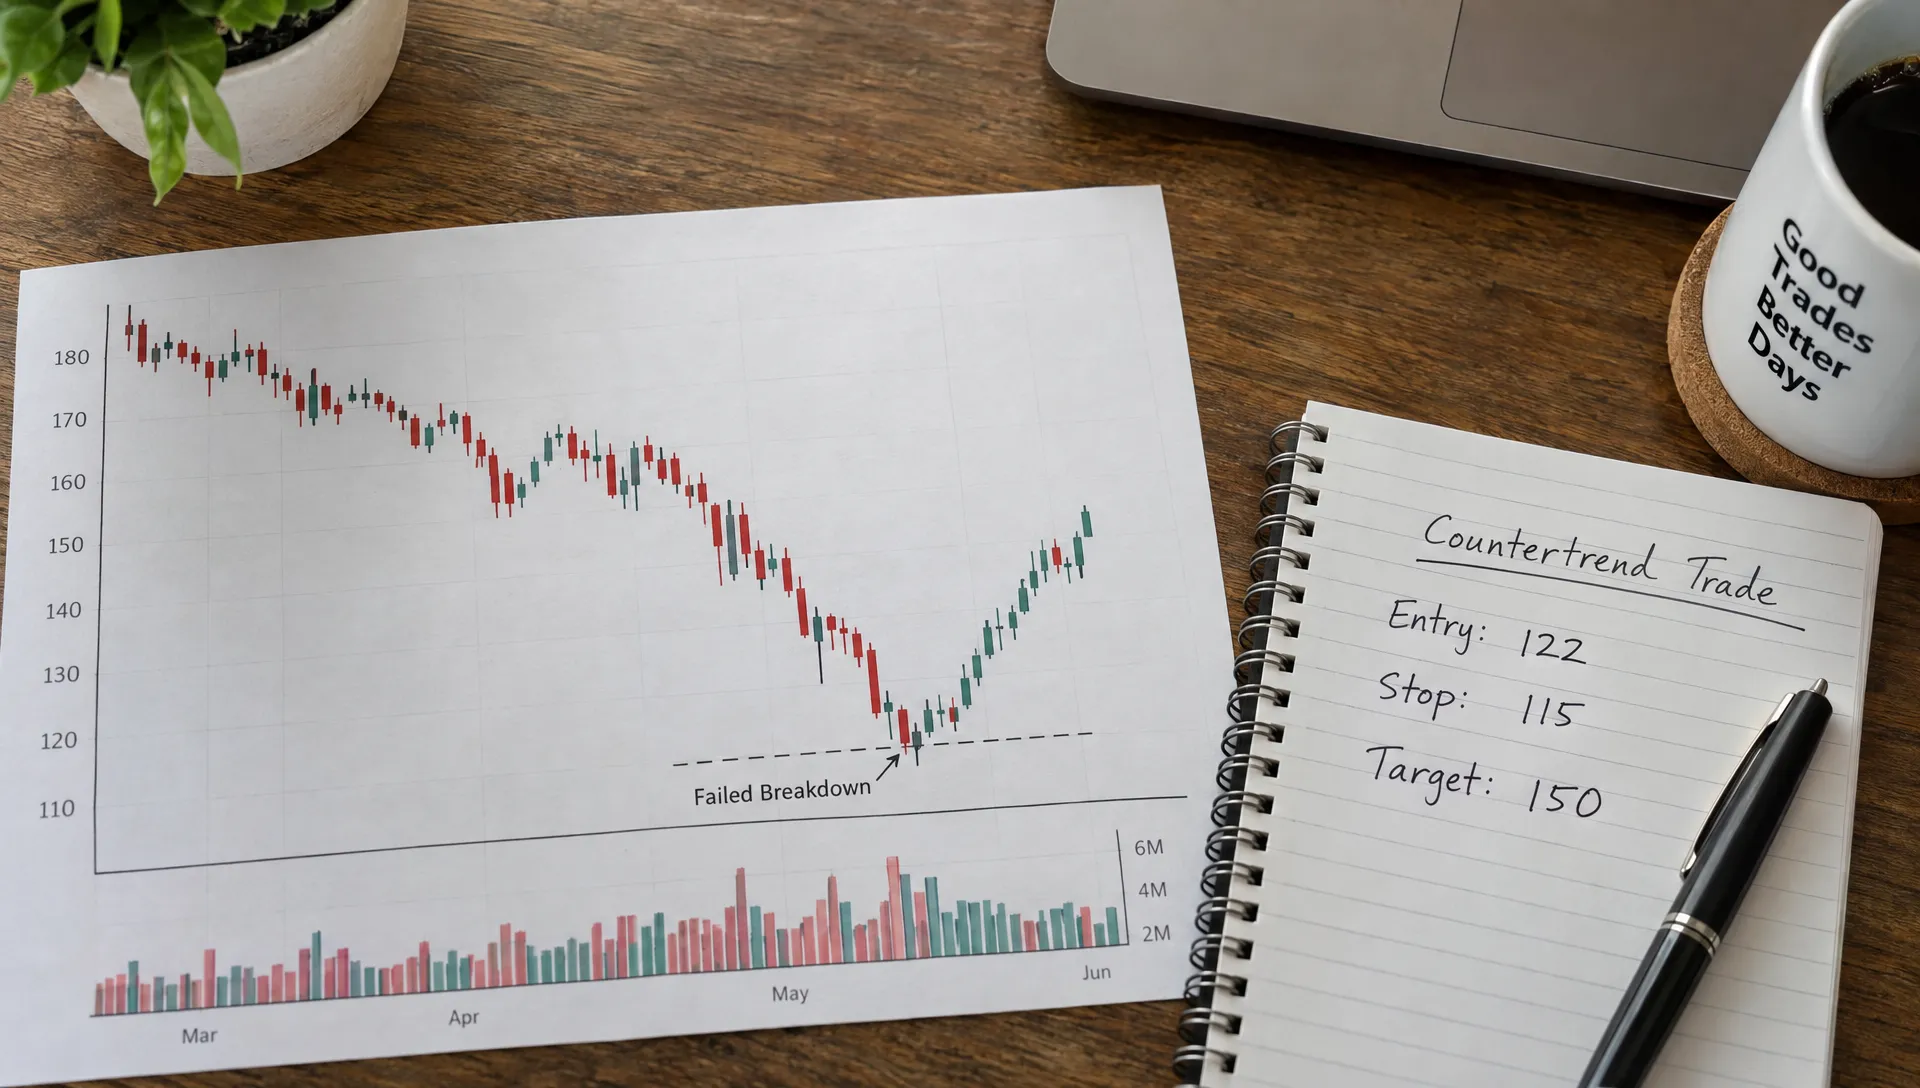
- A failed continuation: Price breaks below that area but cannot sustain the breakdown.
- A reclaim: A completed bar closes back above the level on the timeframe being traded.
- A workable entry: The distance to invalidation remains small enough relative to the next plausible resistance area.
These conditions are a framework to test, not a proven strategy. Specify what counts as a reclaim, whether you require a retest and how long the signal remains valid.
Bullish divergence can support the hypothesis, but it can also persist through further declines. Similarly, higher volume reveals activity, not necessarily accumulation by informed buyers.
The distinction between crowding and an actual reversal matters. Understanding why trending trades can reverse helps explain the mechanism, but an explanation is not a substitute for an executable trigger.
Size from invalidation, not conviction
Countertrend trading needs a loss limit tied to the setup's failure. Choosing a large position first and then squeezing the stop closer to fit your budget reverses that logic.
Consider this hypothetical stock trade. Price has declined from $60, briefly broken below $50 and reclaimed $52. You plan to enter at $52, exit if the setup fails near $50 and target prior resistance at $56.
| Planning input | Hypothetical value |
|---|---|
| Account equity | $25,000 |
| Selected risk budget | 0.5%, or $125 |
| Entry price | $52 |
| Planned stop level | $50 |
| Price risk per share | $2 |
| Estimated additional execution cost per share | $0.10 |
| Position size, rounded down | 59 shares |
The sizing calculation is $125 ÷ $2.10, rounded down. That produces approximately $123.90 of planned risk including the assumed execution allowance. The 0.5% budget is illustrative, not a universal recommendation.
At the stated prices, the trade offers $4 of potential upside against $2 of price risk, or 2:1 before costs. That ratio alone does not demonstrate an edge. It says nothing about how often the target will be reached.
Actual losses can exceed the budget if price gaps, liquidity deteriorates or execution is worse than estimated. A spreadsheet can constrain planned exposure, not guarantee the outcome.
Plan the exit before changing the thesis
An exit plan for countertrend trading should distinguish three events: the setup fails, the intended bounce reaches its destination or the expected response never appears.
In the example, a return through the invalidation area challenges the failed-breakdown thesis. Reaching $56 completes the original objective. Holding beyond that point requires a separate reason, such as newly established upward structure, rather than a sudden decision that the position is now a long-term investment.
A time stop can also be tested. If the setup anticipates a quick rebound but price remains stagnant for several sessions, the original premise may have weakened even without a price-stop breach. The appropriate window depends on the strategy and timeframe.
Order mechanics matter. As Investor.gov explains in its guide to order types, a stop order becomes a market order when triggered, so its execution price is not guaranteed. A stop-limit order controls the acceptable execution price but may remain unfilled.
Shorting an uptrend adds further complications. Borrow fees, recalls and potentially unlimited losses make it different from buying a beaten-down stock. Investors who cannot manage those exposures can study bearish reversals without expressing them through short sales.
Demand positive expectancy after costs
The relevant test for countertrend trading is whether a repeatable setup has positive expectancy after realistic costs, not whether a chart occasionally produces a spectacular reversal.
Expressing results in units of initial risk, or R, makes different trades easier to compare:
Expectancy = (win rate × average gross win) − (loss rate × average gross loss) − average costs.
Suppose a hypothetical strategy wins 42% of the time, averages 2R on winners and loses 1R on losers. If average costs are 0.08R per trade, expectancy is:
(0.42 × 2R) − (0.58 × 1R) − 0.08R = 0.18R per trade.
Those assumptions are illustrative. Actual winners may fall short of the advertised target, while gaps can push average losses above 1R. Partial exits also change the realized payoff profile.
Positive average expectancy does not eliminate losing streaks or establish that a small sample is reliable. Examine drawdowns, the distribution of losses and how much of the result depends on a few exceptional trades. A strategy that looks attractive only before spreads, slippage and borrowing costs is not ready for live capital.
Test the rules without hindsight
Write the entry, stop, target and cancellation rules before reviewing outcomes. Otherwise, it is easy to label successful bounces as obvious reversals and dismiss failed ones as setups you would never have taken.
A useful countertrend trading test includes persistent trends, volatile selloffs and quiet ranges, not just periods that visibly favored reversals. Use completed signals and information available at the time. A daily closing signal, for example, cannot generally assume a fill at that same closing price unless the execution method genuinely supports it.
Separate development data from evaluation data, then paper trade the unchanged rules. Track missed fills as well as executed trades. For stock tests, address corporate actions and survivorship bias, including delisted securities where relevant. Include borrow availability if the strategy sells short.
Treat online strategy claims as marketing until verified. SEO and answer-engine optimization services help businesses gain visibility, but a prominent search result does not establish a trading edge. Look for disclosed methods, realistic execution assumptions and results that can be independently checked.
Paper trading cannot reproduce every execution or emotional pressure. It can still expose ambiguous rules before those ambiguities become expensive.
Use portfolio intelligence as context, not a timing signal
Verified holdings can add useful context to countertrend trading, but they cannot tell you whether a turning point will hold. An investor buying a declining stock might be rebalancing, hedging another position or working with a multi-year horizon.
Upside Invest provides verified investor holdings, portfolio comparisons, trend tracking and private anonymous profiles. Those features can help you investigate whether an apparent opportunity also increases exposure you already have.
For example, buying a software stock after a sharp decline may look like a distinct tactical trade. If your portfolio already contains several correlated growth positions, it may instead deepen the same vulnerability. Multiple small risk budgets do not necessarily produce small aggregate risk when positions move together.
When comparing investors, consider the measurement period, concentration and available risk metrics rather than selecting whoever has the highest recent return. Return and Sharpe figures describe observed performance under particular conditions; they do not establish skill or predict the next trade.
Check timestamps and the information actually available. Verified ownership supports a claim about holdings, not necessarily the owner's intent, complete financial situation or the suitability of that position for you.
Make the trade pass a final decision gate
Before committing capital, reduce the thesis to a short, falsifiable statement: price attempted to continue the trend, failed at a defined location and now offers a specific target before a specific invalidation level.
Countertrend trading is easier to evaluate when the decision is conditional rather than emotional. Use four final checks:
- Evidence: The trigger has occurred on the chosen timeframe, rather than being anticipated.
- Economics: The next plausible target leaves adequate room after spread, fees and estimated slippage.
- Exposure: The position fits both its individual risk budget and the portfolio's correlated exposure.
- Discipline: The plan does not depend on averaging down, moving the stop farther away or waiting indefinitely for recovery.
If a scheduled announcement could overwhelm the setup, account for it before entering. If the rebound has already consumed most of the distance to resistance, passing may be more rational than chasing confirmation at any price.
A valid setup can still lose. The objective is a decision process that remains defensible after either outcome, not a story that makes every loss sound unavoidable.
Frequently asked questions
Is an oversold RSI reading enough to buy? No. RSI can remain oversold during a persistent decline. Combine any indicator with a defined market context, an observable entry trigger and a loss limit. Whether that combination has value still requires testing.
Does the trade need to become a full trend reversal? No. A rebound to nearby resistance may satisfy the entire plan. Assuming every bounce will develop into a lasting reversal can turn a completed tactical trade into an unplanned holding.
Can beginners use countertrend trading? Beginners can study it through paper trading, but live execution requires comfort with failed signals and predefined losses. An unleveraged, tightly specified approach is simpler to evaluate than one involving options, short sales or frequent changes to the rules.
Is a 2:1 reward-to-risk ratio enough? No. A strategy with a distant target can still lose money if it reaches that target too rarely. Evaluate realized average wins, average losses and costs rather than relying on the ratio shown at entry.
Compare the opportunity with your existing risk
Before adding a reversal position, use Upside Invest to compare portfolio allocations and explore verified investor holdings. Look for overlapping exposures and alternative interpretations of the move, not permission to copy another investor. Portfolio intelligence can improve the context of a decision; your entry rules, sizing and exit plan must still stand on their own.