How to Identify a Trending Market in Forex

A trending market in forex is not simply a currency pair having a strong day. It is a sustained directional pattern on a defined timeframe, supported by price structure rather than one headline or oversized candle. For retail investors, the useful question is whether that pattern is clear enough to distinguish from normal fluctuation. This guide shows how to identify the pattern, check it against forex-specific conditions and recognize when the evidence is too mixed to act on.
What a trending market in forex actually looks like
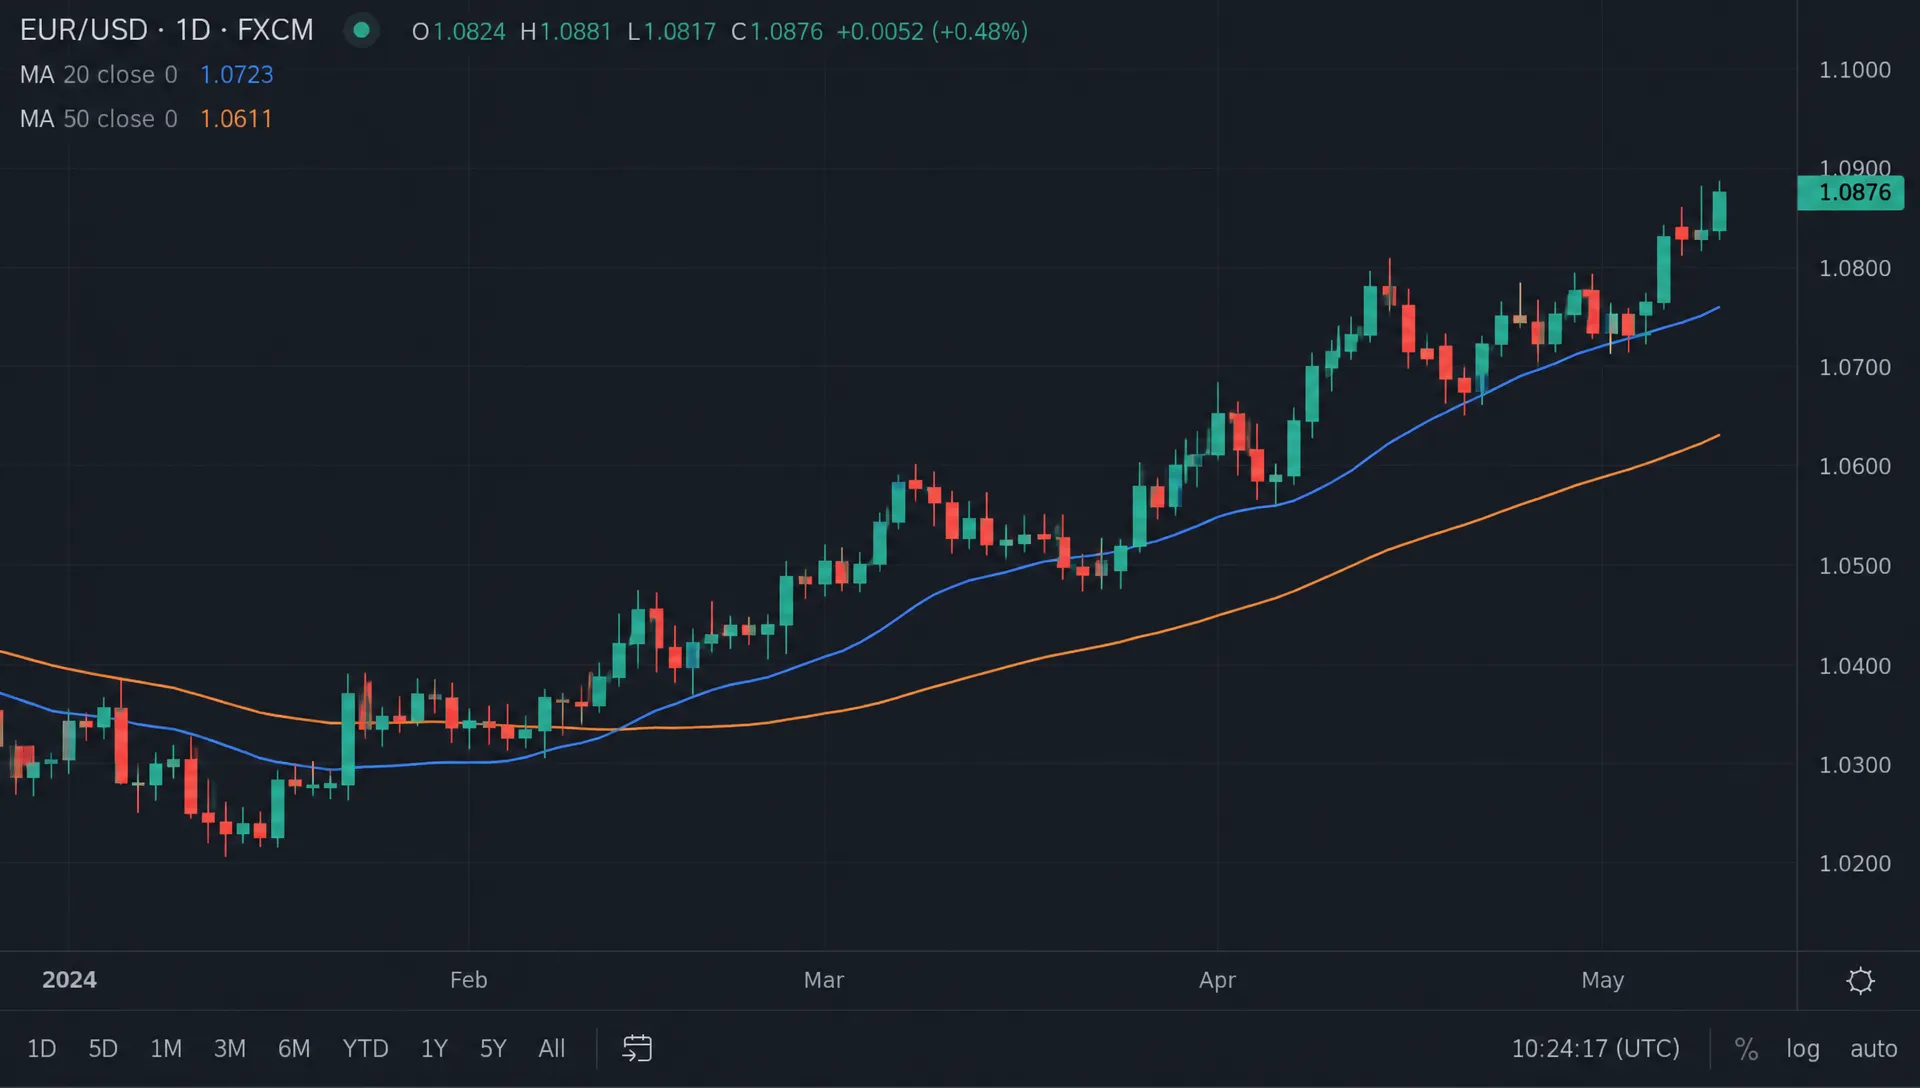
An uptrend generally forms higher swing highs and higher swing lows. A downtrend forms lower swing highs and lower swing lows. A range repeatedly trades between broadly similar boundaries without making sustained directional progress.
These labels depend on your timeframe. EUR/USD can rise on a 15-minute chart while remaining in a daily downtrend. Neither reading is necessarily wrong, but mixing them creates confusing signals.
Remember what the quotation means: when EUR/USD rises, the euro strengthens relative to the US dollar. The move does not prove that the euro is strengthening against every other currency.
| Market condition | Price structure | Typical supporting behavior |
|---|---|---|
| Uptrend | Higher highs and higher lows | Pullbacks hold above previous meaningful lows |
| Downtrend | Lower highs and lower lows | Rallies stall below previous meaningful highs |
| Range | Overlapping swings around similar boundaries | Breakouts frequently return inside the range |
| Unclear transition | Previous structure breaks without an established replacement | Directional follow-through remains inconsistent |
Unclear is a valid classification. You do not need to label every chart bullish or bearish.
Start with price structure, not an indicator
Choose the timeframe before evaluating direction
To identify a trending market in forex consistently, choose your primary timeframe before opening lower-timeframe charts. A swing trader might classify direction on the daily chart and inspect the four-hour chart for detail. An intraday trader might use the hourly chart for context and a shorter chart for execution.
These are examples, not universally optimal combinations. The important part is keeping the classification rule stable rather than switching charts until you find the direction you prefer.
Examine several completed swings. One higher high can be a temporary breakout; repeated directional progress provides better evidence. Also check whether pullbacks preserve the structure or repeatedly erase the preceding advance.
Define swing points consistently
A practical swing high is a local peak surrounded by lower highs. A swing low is a local trough surrounded by higher lows. You can mark them visually or use a fixed rule, such as requiring two completed candles on either side.
That rule introduces confirmation delay: you cannot know that a candle qualifies until the later candles have closed. This matters when reviewing historical charts, where turning points can appear obvious before they would have been identifiable live.
Mark only the swings relevant to your chosen timeframe. Counting every tiny fluctuation can make an orderly daily trend look chaotic and encourage unnecessary changes in direction.
Use moving averages and ADX as supporting checks
Moving averages show alignment, not certainty
A rising 20-period exponential moving average above a rising 50-period average can support an upward classification. The reverse alignment can support a downward one. Those settings are common examples, not special numbers that work across every pair and timeframe.
For a trending market in forex, moving-average slope and the behavior of pullbacks usually provide more context than a crossover alone. Flat averages with price repeatedly crossing both suggest that directional organization is weak.
Moving averages lag price. They can remain bullish after the underlying swing structure deteriorates, so avoid allowing them to overrule a meaningful structural break.
ADX measures strength, not direction
The Average Directional Index, or ADX, evaluates trend strength without identifying whether price is rising or falling. As Fidelity’s ADX guide explains, readings above 25 are commonly interpreted as indicating a stronger trend, while readings below 20 suggest weaker trend conditions.
Treat those levels as conventions rather than guarantees. A rising ADX can accompany a downtrend, and an elevated reading can persist after a move becomes extended.
Price structure, moving averages and ADX all draw on price data. Their agreement is useful, but it is not three independent sources of evidence. Adding more price-derived indicators can make a chart look convincing without adding much information.
Adjust your analysis for how forex trades
Account for sessions and scheduled announcements
A trending market in forex can look stronger during an active session and less convincing during quieter trading hours. The London-New York overlap often brings substantial participation in major pairs, but activity alone does not establish direction.
Check whether the apparent move survives beyond its initial session. A breakout that holds through subsequent trading offers different evidence from a brief spike that immediately returns to the previous range.
Before interpreting a large candle, check the economic calendar. Central-bank decisions, inflation releases and employment reports can produce sharp repricing. Wait for completed candles and assess follow-through rather than treating the announcement reaction as an established trend.
Understand the limits of retail volume
Spot forex is an over-the-counter market, not a single exchange with one consolidated volume feed. The BIS foreign-exchange market survey describes activity across this global OTC market.
Your broker’s tick volume generally measures quote updates in its feed, not total worldwide trading volume. It can help compare activity within that same feed, but it should not be presented as universal confirmation.
Currency futures volume offers exchange-based information, though it covers a different instrument and only part of overall currency activity. Use either measure with its limitations in mind.
Check the economic driver without forcing a story
Interest-rate expectations, inflation surprises and changing growth expectations can explain why currencies diverge. The relevant comparison is between the two economies in the pair, not whether one country received apparently positive news.
A trending market in forex does not require a neat explanation for every candle, but a plausible driver helps you identify which upcoming information could challenge the move. Strong economic data may still weaken a currency if the market expected an even stronger result.
For goods-trade-sensitive currencies, shipping costs and customs delays also belong in the economic background. Understanding services such as SHIPIT Logistics’ freight forwarding and cross-border logistics helps explain the operational steps behind imports and exports. Those conditions can affect businesses and trade flows, but a shipping disruption has no fixed exchange-rate effect and is not a standalone trading signal.
Apply the checks to a hypothetical EUR/USD chart
Suppose a daily EUR/USD chart produces the following completed swings. These numbers are illustrative, not current market prices.
| Observation | Hypothetical level | Interpretation |
|---|---|---|
| Earlier swing low | 1.0800 | Initial reference low |
| Earlier swing high | 1.0860 | Initial reference high |
| Later swing low | 1.0830 | Higher low |
| Later swing high | 1.0900 | Higher high |
The sequence supports an upward classification. If the 20-period average is rising above the 50-period average and ADX reads 27, the indicators also support that interpretation.
This is evidence of a trending market in forex on the daily timeframe, not proof that buying immediately has a favorable risk-reward profile. Price could already be far above the latest structural support, leaving substantial downside before the trend classification is invalidated.
A four-hour pullback does not automatically reverse the daily trend. However, a daily close below the identified 1.0830 swing low would weaken this particular higher-low structure. You would then reassess rather than keep calling the chart bullish because its moving averages had not yet crossed.
The distinction is essential: identifying a trend and selecting a trade are separate decisions.
Use a repeatable five-check classification
Before labeling a chart, record the same observations each time:
- Timeframe: State which chart determines your trend classification.
- Structure: Mark the latest meaningful highs and lows using a consistent swing rule.
- Persistence: Check whether completed candles hold directional progress instead of repeatedly returning to the old range.
- Supporting measures: Review moving-average slope and ADX without treating them as independent guarantees.
- Context: Note session conditions, scheduled announcements and the level that would invalidate your reading.
This checklist makes your assessment reviewable. “Bullish because the chart looks strong” is difficult to test; “daily higher highs and higher lows, with the latest confirmed low intact” is much more precise.
When assessing a trending market in forex, classify conflicting evidence as mixed rather than inventing an arbitrary score that implies certainty. A clear price trend with weak ADX may be developing, while strong ADX with broken structure may reflect an aging move.
If you automate these checks in MetaTrader, first examine whether signals change after candles close. Upside’s guide to testing a trend meter indicator in MT4 covers repainting, higher-timeframe data and realistic testing costs.
Separate trend identification from risk management
A correctly identified trend can still produce a losing trade. Entry timing, spread, financing costs and leverage affect the outcome, and a stop order may execute at a worse price during gaps or fast markets.
Before entering, define the price behavior that would invalidate your idea. Set position size from the distance to that invalidation point and the loss you are prepared to accept, rather than choosing a position first and squeezing the stop to fit it.
A trending market in forex can also create overlapping exposure across pairs. Long EUR/USD and long GBP/USD both contain short-dollar exposure, so they are not automatically diversified bets. Correlations change, but shared currency exposure remains worth checking.
Retail forex leverage can magnify losses quickly. The CFTC’s forex advisory explains risks involving leverage and OTC dealers. Practice a classification method in a demo account before committing capital, while remembering that demo execution may differ from live trading.
For the next step beyond identification, use risk-based technical trend trading rules to connect invalidation, position sizing and trade management. A directional label is context, not permission to take unlimited risk.
Frequently asked questions
What is the simplest way to identify a forex trend? Choose one timeframe and mark completed swing highs and lows. Higher highs with higher lows suggest an uptrend; lower highs with lower lows suggest a downtrend. Repeatedly overlapping swings suggest a range or an unclear transition.
Which indicator best confirms a trending market in forex? No single indicator reliably confirms every trend. Moving averages help describe direction and ADX helps assess strength. Both should support, rather than replace, a consistent reading of price structure.
Does ADX above 25 mean I should enter a trade? No. ADX does not show direction, entry quality or the distance to your invalidation point. A high reading can occur after much of a move has already happened.
Can a currency pair trend on one timeframe and range on another? Yes. A shorter-term range can sit inside a longer-term trend, and an intraday rally can occur within a daily decline. Define which timeframe controls your analysis before interpreting the others.
How do I know a trend has ended? A break of the latest meaningful swing structure is a warning that your existing classification may no longer hold. It does not immediately prove an opposite trend; the market may enter a range or transition first.
Put currency analysis in your portfolio context
Forex analysis addresses a pair’s direction, not the risk of your entire portfolio. Currency-sensitive stocks, international funds and other positions can add exposures that are easy to miss when reviewing one chart at a time.
Upside Invest offers verified investor holdings, anonymous profiles and portfolio comparison tools to help you examine broader allocations. Use that portfolio perspective alongside your forex checklist, keeping community comparisons separate from the evidence needed to justify an individual trade.