How to Test a Trend Meter Indicator MT4 Before Trading
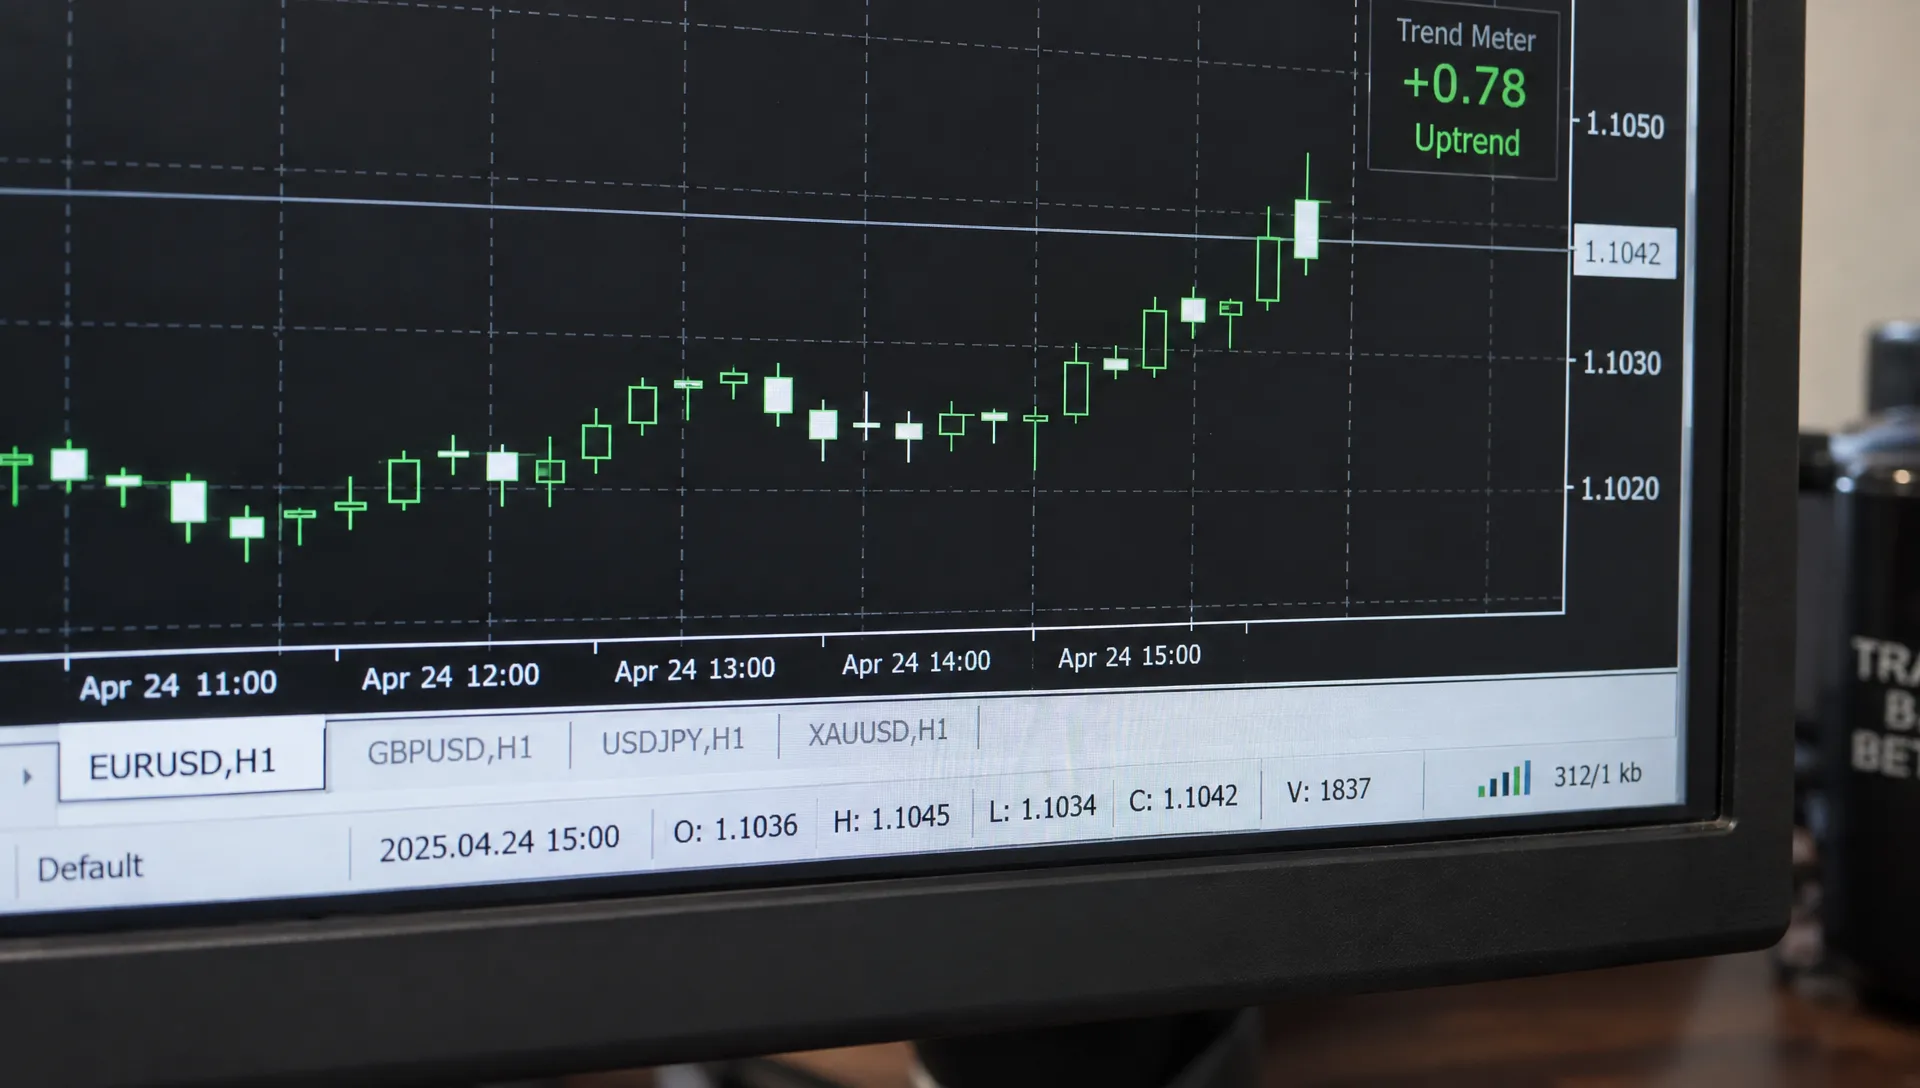
A tool sold as a “trend meter indicator mt4” can look convincing on a historical chart and still fail when signals arrive in real time. Colors may change before a candle closes, higher-timeframe inputs may remain unfinished and trading costs may erase an apparent edge.
Test the indicator’s behavior first, then test a precisely defined trading strategy that uses it. Those are different tasks. An indicator can calculate correctly without improving your entries, exits or returns.
This guide covers both tests: checking signal integrity in MetaTrader 4, building a reproducible backtest and deciding whether the tool deserves further evaluation on a demo account.
Document your trend meter indicator mt4 setup
“Trend meter” is a category label, not a standardized calculation. One download might combine moving averages and RSI. Another might display agreement across several timeframes or instruments. Similar-looking dashboards can produce very different signals.
Before testing, identify the exact indicator version, its inputs and what each color or score represents. Establish whether signals update on every tick or only after a candle closes. Also check whether the display uses other symbols, higher timeframes or external data.
If the documentation does not explain how signals are generated, you can still observe behavior, but you cannot fully audit the logic. That limitation belongs in your test report. Upside’s guide to technical trend indicators traders actually use can help you understand common components without assuming your download uses them.
Freeze the configuration before collecting results
Record the broker, symbol, chart timeframe, indicator settings and testing dates. Keep a copy of the indicator file so an update does not silently change your experiment.
For a trend meter indicator mt4 test, distinguish between an .mq4 source file and a compiled .ex4 file. Source code allows inspection when available; a compiled file alone does not reveal the underlying logic.
Install unfamiliar software in a separate demo environment. Leave DLL imports disabled unless a necessary dependency has been assessed and you trust its source. A request for permissions is not evidence of better performance.
Create a configuration sheet containing the signal definition, execution timing, exit rules and cost assumptions. Changing any of these creates a new test version, not a continuation of the original experiment.
Check for repainting and future-data leakage
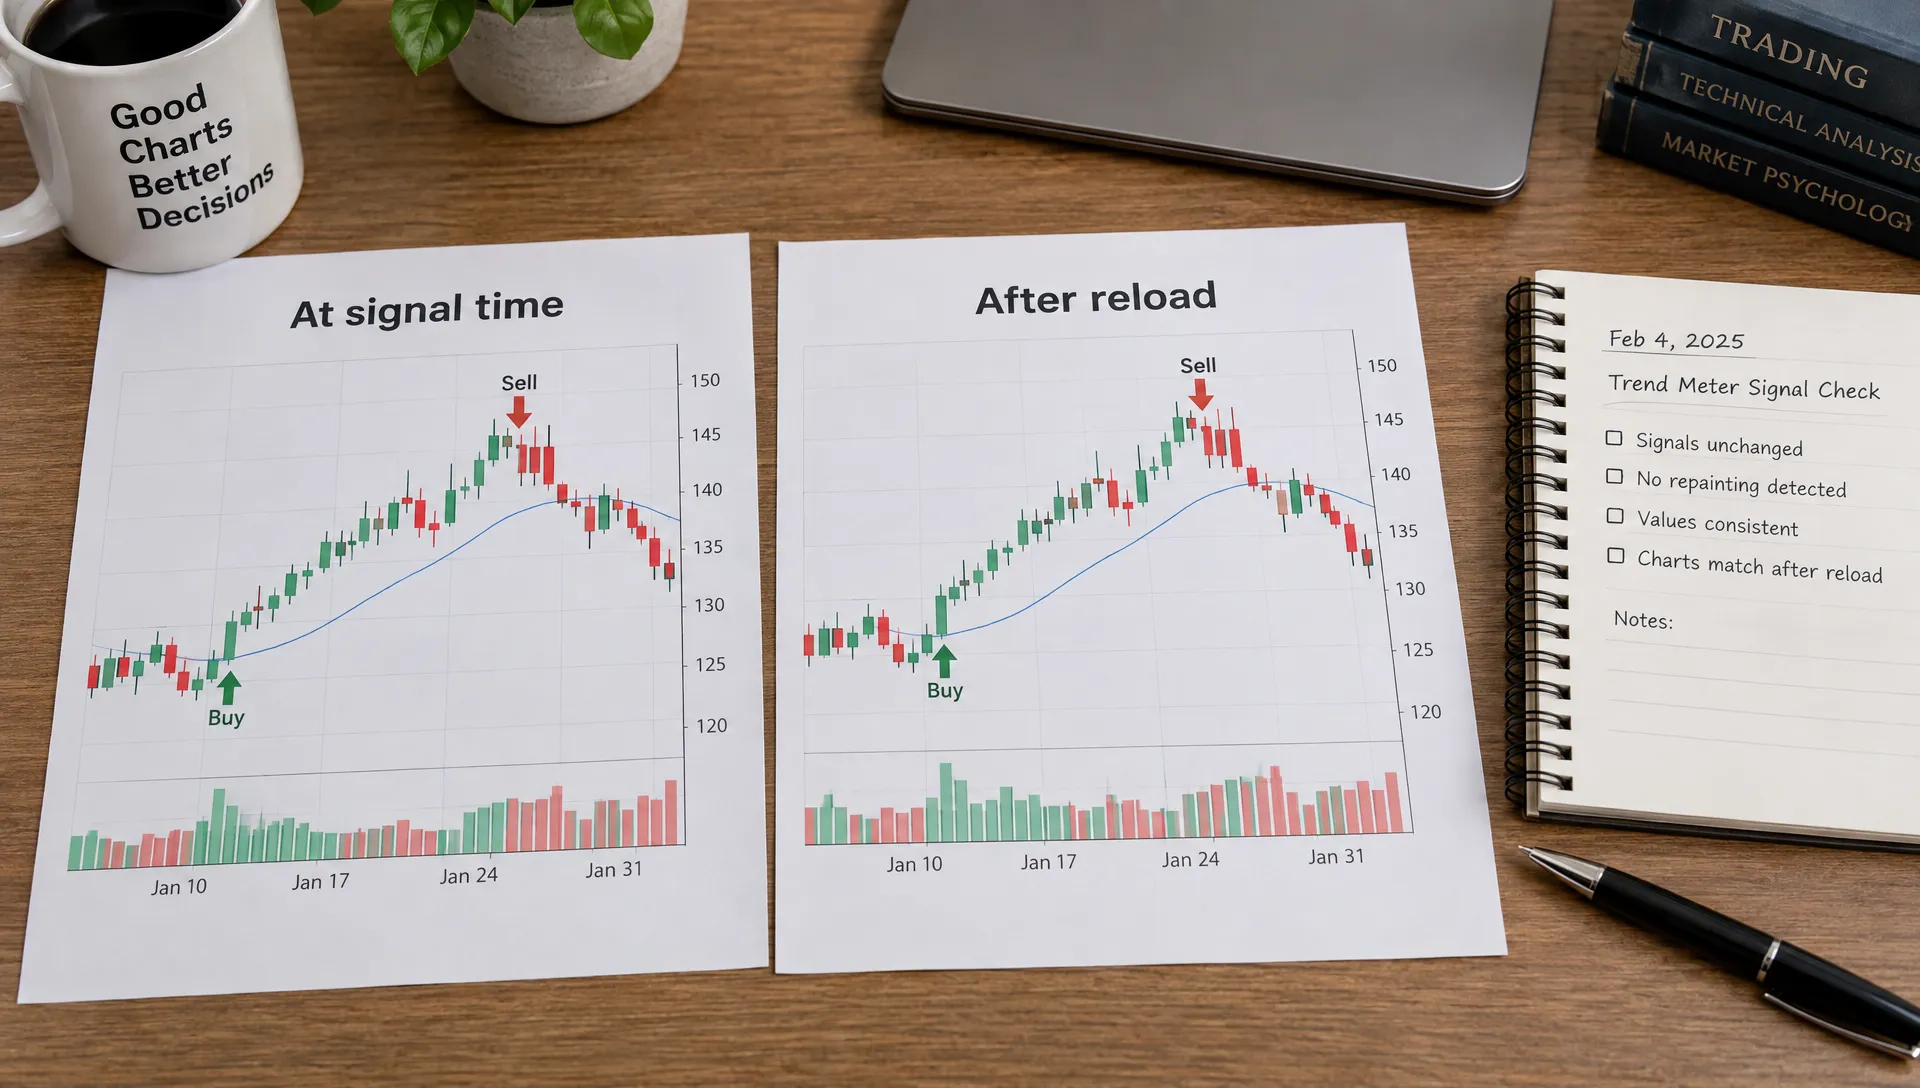
A historical chart shows what the indicator displays now, which may differ from what it displayed when a trading decision was possible. Your first task is to compare those two states.
During live demo observation, save the signal value and candle timestamp immediately after each relevant bar closes. Later, compare the saved value with the indicator’s display for that same bar. Repeat after refreshing the chart or restarting MT4.
A practical log should include:
- Signal identity: Symbol, timeframe, candle timestamp and indicator version.
- Observed output: Color, score or buffer value captured at the decision time.
- Observation timing: Broker server time and whether the relevant candles were closed.
- Later comparison: The historical value after additional bars, a refresh or a restart.
The critical question in a trend meter indicator mt4 repainting test is whether a signal that was available for trading later disappears or changes. Updates to the currently forming candle are not automatically a defect, but you must not backtest its final value as though it was known earlier.
Changes to older signals deserve investigation. Revised market data, unfinished inputs or calculations that use later observations can all affect historical displays.
Treat higher-timeframe signals separately
A closed five-minute candle does not mean the current one-hour candle has closed. If your meter uses that unfinished hourly candle, its reading can continue changing throughout the hour.
Choose one policy before testing: use only completed higher-timeframe candles, or allow developing readings and record exactly what was available at each decision time. Do not mix these approaches between historical and forward tests.
In MQL4, shift 0 generally refers to the current bar and shift 1 to the previous bar for the series being queried. Reading a closed chart candle does not automatically make every higher-timeframe input final.
Indicators that place signals on earlier candles after later confirmation also need special treatment. The tradable timestamp is when confirmation became available, not where the marker eventually appears.
Convert the display into an executable trading rule
“Buy when the meter looks strong” is not reproducible. Define exactly what qualifies as a signal and when an order could be placed.
An illustrative rule might require a bullish reading on a completed candle, entry at the next available price, an initial stop based on a predefined volatility measure and an exit after a fixed number of bars or an opposite closed-bar signal. These are test specifications, not recommended settings.
Your trend meter indicator mt4 strategy also needs rules for repeated signals, simultaneous positions and signals received while a trade is already open. Otherwise, two people can interpret the same chart and generate incompatible results.
Set position sizing before testing. Fixed risk per trade can help comparisons, but the amount must account for the instrument’s contract specifications and stop distance. Upside’s guide to trend trading rules for managing risk explains how invalidation and sizing fit together.
Use MT4’s tester without confusing visualization with performance
MT4’s Strategy Tester supports visual indicator testing, but displaying signals does not by itself establish strategy profitability. Automated trade statistics require an Expert Advisor that implements your entry, exit and sizing rules. Alternatively, record simulated trades manually during a controlled visual replay.
An EA can access exposed custom-indicator buffers through MQL4’s iCustom function. Verify the input order, buffer mapping and bar shift against the indicator’s documentation. Some dashboards draw chart objects without exposing convenient signal buffers.
A trend meter indicator mt4 backtest is only useful if the execution harness reads the same information you would have seen live. Check several individual trades against the chart and signal log before trusting aggregate results. Include enough earlier history for all indicator components to initialize.
Model spreads, slippage and financing costs
Small, frequent trades are particularly sensitive to execution assumptions. A signal may predict direction correctly while producing losses after costs.
Account for the bid-ask spread, commissions and realistic adverse slippage. Include swap or financing charges if the strategy holds positions overnight. Use the specifications for the broker and instrument you actually intend to evaluate.
Do not assume an MT4 “Every tick” test automatically contains verified historical bid and ask ticks. Depending on the data and setup, ticks may be modeled from lower-timeframe history. A configured test spread also does not recreate changing historical spreads.
For a trend meter indicator mt4 cost test, run both a normal-cost scenario and a deliberately harsher scenario. Document the assumptions rather than choosing costs that make the results attractive.
Check pip-versus-point conversions, tick values, minimum lot sizes and rounding. These details vary across instruments and can materially distort simulated risk. If the stop and target can both be reached inside one candle, bar-only data may not establish which happened first. Use suitable intrabar data or flag those trades as uncertain.
Reserve unseen data before adjusting settings
Divide the available history chronologically. Use the earlier segment to develop rules, a later segment to validate limited choices and a final untouched segment to evaluate the frozen strategy.
Do not randomly shuffle individual trades into training and testing groups. Neighboring trades often share market conditions, and random splits can blur the distinction between development and genuinely later performance.
The out-of-sample trend meter indicator mt4 test must use the settings you selected before seeing its results. If you repeatedly change parameters after inspecting the holdout period, that period has become development data.
Include trending, sideways, quieter and more volatile conditions where relevant to the intended market. Also test a modest range of nearby settings. A single highly profitable parameter surrounded by poor results is less convincing than a reasonably stable region.
Keep a record of every variant you tried, including unsuccessful ones. Testing dozens of combinations and reporting only the winner hides the selection process. For a stronger check, use walk-forward testing: develop on an earlier window, freeze the rules and test on the next window before advancing through time.
Measure whether the indicator adds value
Compare the strategy with a simple baseline, not just with zero profit. For an entry filter, a useful comparison is the same underlying strategy without the meter, keeping other rules and costs consistent.
Evaluate net expectancy, maximum drawdown, trade count, market exposure and performance across separate periods. Check whether profits depend on a handful of unusually large winners. Win rate alone can be misleading: a hypothetical strategy winning 60% of trades at an average gain of 0.5R and losing 40% at 1R has expectancy of negative 0.1R before costs.
A successful trend meter indicator mt4 evaluation should show what improved and what deteriorated. The meter might reduce drawdown but also eliminate profitable trades. Whether that trade-off is useful depends on your stated objective.
Demand evidence that can be reproduced
A smooth equity curve or impressive screenshot is not a complete report. Request the settings, testing dates, broker data, cost assumptions and trade-level records needed to explain the result.
The distinction between presentation and measurable outcomes applies outside trading too. Goodjuju’s property management marketing services use lead tracking and monthly reporting to evaluate campaigns. For an indicator, the equivalent evidence is a timestamped signal log and reproducible trade history, not an attractive dashboard.
No universal trade count proves reliability. A small sample is especially vulnerable to luck, while a large sample collected in one narrow market regime may still provide weak evidence about other conditions.
Forward-test on demo before considering real capital
Historical testing cannot fully reproduce delayed alerts, missing symbol data, terminal interruptions or the practical difficulty of following a rule. A demo test helps expose those operational problems.
Use the same broker environment, instruments and settings as the intended setup where possible. Record signals as they occur, including valid signals you miss. Capture the quote when the signal arrives and the execution price when an order is placed.
During a trend meter indicator mt4 forward test, do not repair disappointing results by changing settings midway. End that version, document why you changed it and begin a new test separately.
Compare demo observations with historical expectations. Look for different signal frequency, delayed notifications, unexpectedly wide spreads and mismatches between logged signals and later chart displays.
Set a review date and evidence requirements before starting, but do not mistake a short run of profitable demo trades for proof. Demo fills can differ from live execution. Any later live trial should therefore be limited by a predefined loss budget and stopping rules, not by confidence in a recent winning streak.
Make a pass, revise or reject decision
Use a written decision table so a persuasive chart does not override a failed test.
| Test area | Evidence to look for | Reason to pause or reject |
|---|---|---|
| Signal integrity | Logged signals match later records under the chosen policy | Historical signals change without explanation |
| Timing | Inputs were available when orders could be placed | Results rely on future or unfinished data |
| Execution | Trades follow frozen rules with documented costs | Entries assume unavailable prices or omit material costs |
| Robustness | Results remain useful on unseen data and nearby settings | Performance depends on one optimized configuration |
| Operational fit | Demo signals and execution match the specification | Alerts, data access or permissions remain unreliable |
Passing these checks makes a trend meter indicator mt4 strategy a candidate for further evaluation, not a proven source of returns. Reject tools with unresolved signal-integrity problems. Revise tests with fixable data or implementation errors, then rerun them without combining incompatible results.
Frequently asked questions
Do all MT4 trend meters repaint? No. Behavior depends on the calculation and inputs. Some only update the current candle; others revise older readings. Compare timestamped observations with later displays instead of relying solely on a vendor’s description.
Can I backtest a trend meter without an Expert Advisor? You can inspect its behavior visually and manually record rule-based simulated trades. An EA is needed to automate trade execution and generate strategy performance reports, but its implementation must be checked.
What settings are best for a trend meter indicator mt4? There is no universal best configuration. Evaluate a limited set of settings against a defined objective, realistic costs and unseen data. Avoid selecting parameters solely because they produced the highest historical return.
Does a profitable backtest justify live trading? Not by itself. It can contain modeling errors, overfitting or unrealistic execution assumptions. Signal validation, out-of-sample testing and forward observation provide additional checks, without guaranteeing future performance.
Keep portfolio research separate from indicator validation
A trading signal answers a timing question. It does not establish whether a position fits your broader allocation or risk exposure.
Upside Invest offers verified investor holdings, anonymous portfolio comparisons and return and Sharpe metrics to support that broader research. Use those insights as context for portfolio decisions, not as proof that an MT4 indicator works. For the indicator itself, keep the evidence standard concrete: observable signals, reproducible rules, realistic costs and results from data you did not optimize against.