How to Practice Trading Price Action Using Al Brooks Concepts

If you searched for “trading price action al brooks,” the most useful next step is not memorizing more chart patterns. It is learning to make consistent decisions on an unfamiliar chart, one completed bar at a time.
Brooks’ approach emphasizes context: whether the market is trending, trading sideways or attempting a transition. A promising signal bar means little without that context. This guide turns those ideas into a practice routine using chart replay, one narrowly defined setup and a decision journal.
The goal is a repeatable learning process, not a promise of profitable trading. Start in simulation, where mistakes do not put your capital at risk.
Trading Price Action Al Brooks Style: Start With Context
Price action analysis uses price movement to interpret buying and selling pressure. Brooks examines individual bars, their relationship to preceding bars and the larger market structure.
Begin each chart with a provisional classification:
| Market condition | What to examine | Practice question |
|---|---|---|
| Trend | Directional progress, pullback depth and bar overlap | Are pullbacks interrupting an intact trend? |
| Trading range | Repeated overlap, two-sided movement and failed breakouts | Is price near a boundary or the middle? |
| Breakout attempt | Movement beyond an established boundary and subsequent follow-through | Does price remain outside the old structure? |
| Possible reversal | Weakening continuation followed by opposing pressure | Has the trend actually changed or merely paused? |
These are working interpretations, not objective labels every trader will assign identically. Record the evidence that would change your classification.
Brooks also uses the term Always In to describe directional bias. Treat it as an analytical question about which side currently has the stronger case, not an instruction to remain continuously invested.
For Al Brooks’ approach to trading price action, context comes before the entry pattern. A bullish bar near the middle of a choppy range does not carry the same implications as one following a controlled pullback in an established uptrend.
Choose Between Books, a Course and Chart Practice
Brooks’ three-book Trading Price Action series separates the material into Trends, Trading Ranges and Reversals. The subjects overlap, but each volume emphasizes a different market condition. His earlier Reading Price Charts Bar by Bar is another resource, though its detailed terminology can be demanding for beginners.
Choose your starting format around how you learn:
- Books: Useful if you prefer rereading explanations and annotating charts at your own pace.
- A structured course: Worth considering if narrated examples help you understand sequencing and context.
- Chart replay: Necessary for testing whether you can apply an explanation without seeing the outcome first.
Consult the official Brooks Trading Course website for current descriptions and available samples. Check the current terms before purchasing rather than relying on old reviews or quoted prices.
Testimonials and selected winning examples do not establish typical student returns. Without independently audited results from a representative student group, judge educational value separately from claims about profitability.
Learning to trade price action using Al Brooks concepts does not require buying every resource first. Study one concept, practice it on unseen charts and identify what remains unclear before purchasing more instruction.
Build a Replay Workspace That Limits Hindsight
Choose one liquid instrument and one chart interval for your initial practice. A five-minute chart offers frequent decisions but demands more attention. A daily chart moves slowly enough to allow written analysis, although overnight gaps introduce different risks. Neither interval is inherently more profitable.
Keep the chart simple. Candlesticks and relevant prior price levels may be enough. A 20-bar exponential moving average, commonly used in Brooks’ teaching, can provide a reference without becoming an automatic buy or sell rule.
Before starting, standardize your data source, session hours and handling of stock splits or futures contract changes. Inconsistent chart settings can make otherwise similar examples difficult to compare.
Hide future bars and select practice dates in advance. Include quiet sessions, failed breakouts and difficult ranges rather than only memorable trend days.
Write your assessment before revealing the next bar. If you explain a setup only after seeing its outcome, you are practicing retrospective storytelling rather than decision-making.
This distinction matters throughout Al Brooks-style price action practice: recognizing a pattern afterward is easier than deciding whether it deserves a trade in real time.
Practice One Setup: A Second-Entry Pullback Buy
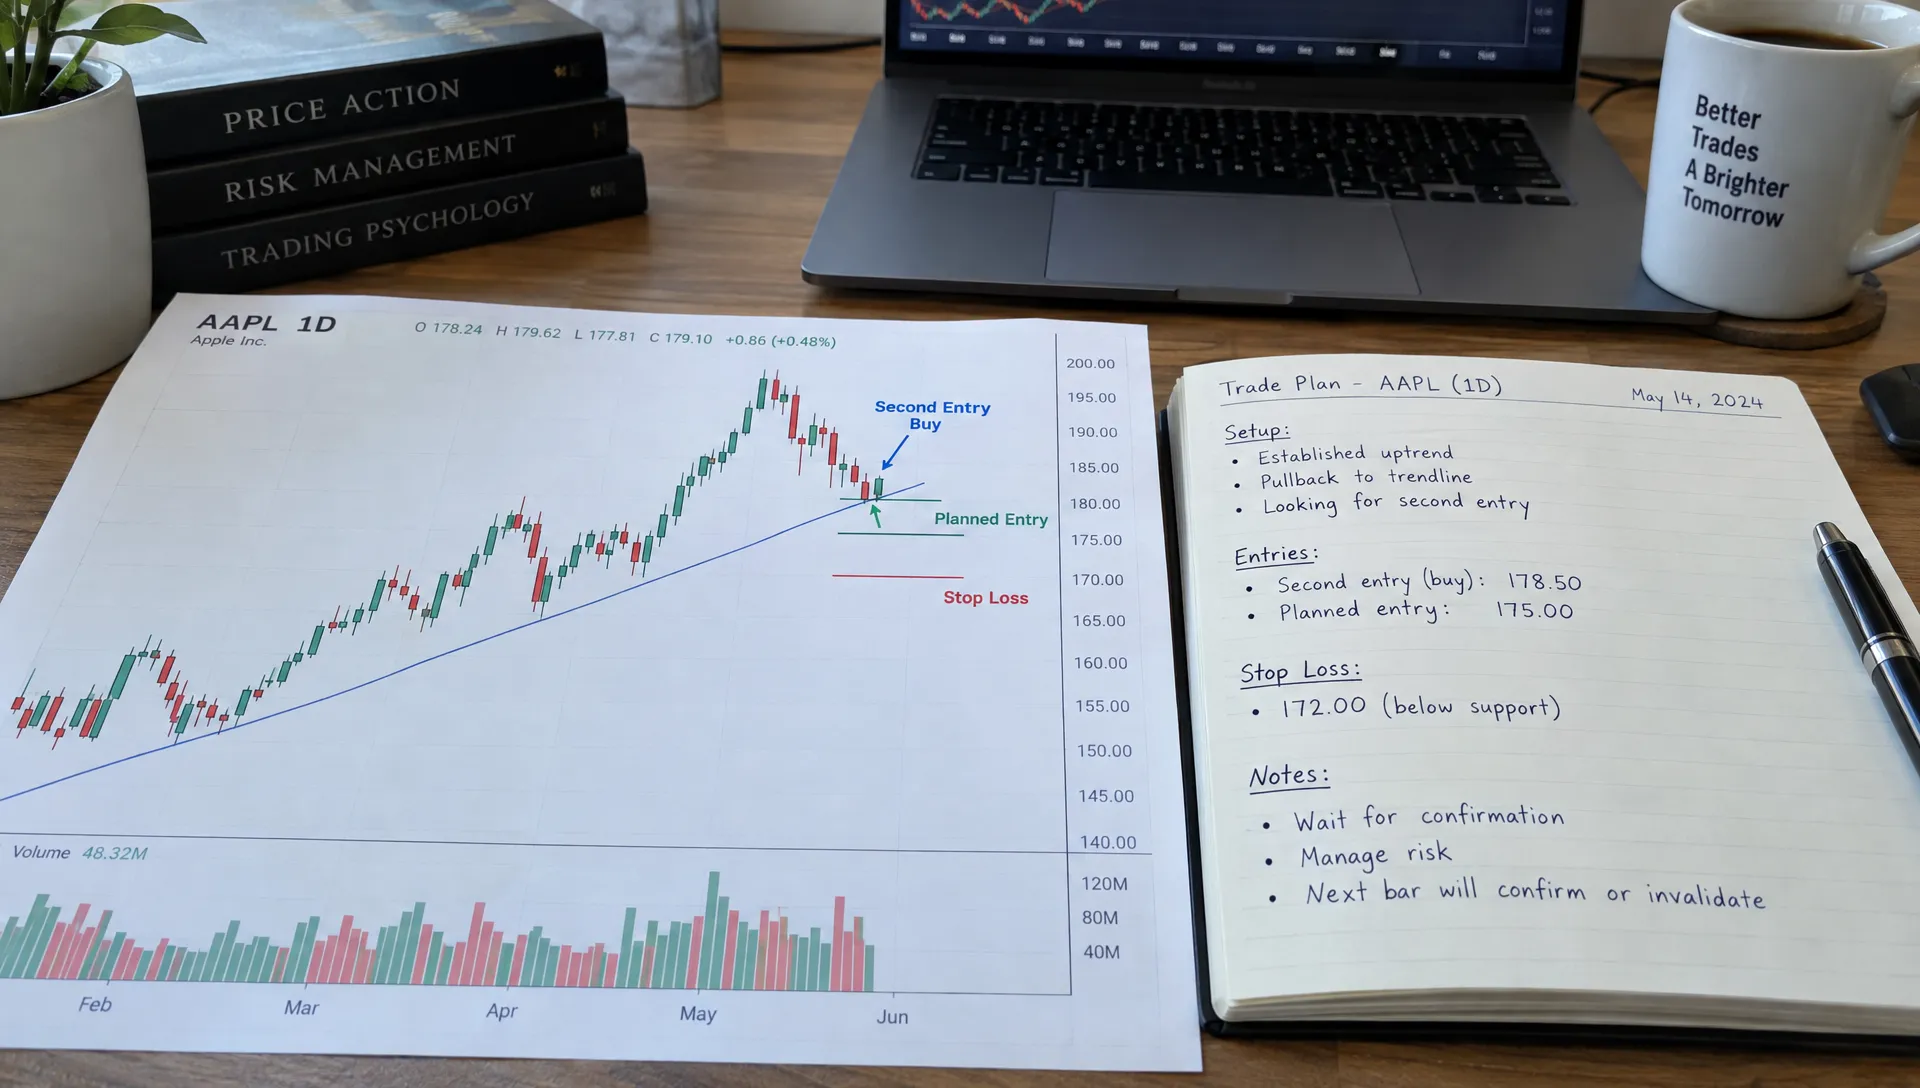
A second-entry buy is a useful training subject because it combines trend context, a pullback and an attempted resumption. It is not automatically a high-probability trade.
In Brooks’ terminology, a High 1 is the first occurrence during a bull pullback of a bar trading above the previous bar’s high. If that attempt does not end the pullback and another qualifying attempt follows, the second is a High 2. Counting can become ambiguous in complex pullbacks, so document the convention you use.
For an initial exercise, restrict yourself to relatively clear examples. Require an established upward move, a recognizable pullback and enough room before nearby resistance to justify the planned risk. Exclude confusing counts rather than forcing every chart into the pattern.
Distinguish the signal bar, which provides the potential setup, from the entry bar, on which your entry order would trigger. A signal is not a completed trade.
Write down the proposed entry, the price that invalidates your idea and the exit plan before advancing replay. Do not assume that a stop beneath a small signal bar is appropriate if the broader setup requires a wider invalidation level.
This is a deliberately narrow exercise, not a complete representation of Brooks’ discretionary method. For additional context on pullbacks and execution, Upside’s guide to trading an intraday trend without chasing it explains why directional conviction alone is insufficient.
Use a Bar-by-Bar Decision Drill
At each completed bar, answer the same five questions:
- What is the current market condition? Record trend, range or uncertain transition, with one supporting observation.
- What changed on this bar? Note follow-through, rejection, overlap or a failed attempt.
- Does my predefined setup exist? Separate a valid setup from something that merely resembles it.
- Where is the idea invalidated? Identify the structural reason for the stop rather than choosing a convenient dollar amount.
- Should I act or remain flat? Record the decision before revealing more data.
Keep each answer brief. “Bull trend, shallow pullback, second attempt upward, resistance too close, pass” is more useful than a long explanation written after the market rallies.
Include no-trade decisions in your journal. Otherwise, you cannot tell whether your filtering process helps or merely excludes trades selectively in hindsight.
When practicing Al Brooks’ approach to trading price action, the observation process should remain stable even when your market opinion changes. Updating a view after new evidence is appropriate; rewriting the original view is not.
Walk Through a Hypothetical Trade
Suppose a replay chart shows an upward trend followed by a pullback. Your predefined second-entry conditions appear and you record this illustrative plan:
| Item | Hypothetical value |
|---|---|
| Planned entry | $50.10 |
| Structural stop | $49.70 |
| Initial risk per share | $0.40 |
| Planned target | $50.90 |
| Gross reward-to-risk ratio | 2:1 |
| Position size | 50 shares |
| Planned loss at the stop | $20 before costs and slippage |
The arithmetic is straightforward: 50 shares multiplied by $0.40 equals $20 of planned price risk. It does not guarantee that the realized loss will be limited to $20.
The target must also make sense on the chart. If substantial resistance sits at $50.45, drawing a target at $50.90 does not make that resistance disappear. Your rules might require passing on the trade.
Specify how replay handles execution. A gap through the entry can produce a worse fill. If one historical bar touches both the stop and target, its open, high, low and close do not establish which occurred first. Use finer-resolution data where available or a consistent conservative assumption.
A clean chart example is not evidence of an executable edge. Practicing price action with Al Brooks concepts still requires realistic treatment of spreads, commissions and slippage.
Keep a Journal That Separates Process From Results
A winning trade can follow a poor decision. A losing trade can follow your rules correctly. Track both dimensions instead of grading yourself solely on profit and loss.
| Journal field | What to record |
|---|---|
| Context | Instrument, interval, session and market condition |
| Setup | Exact qualifying observations and exclusions |
| Pre-decision evidence | Screenshot with future bars hidden |
| Plan | Entry, invalidation, exit method and position size |
| Execution | Assumed fills, costs and any ambiguous bars |
| Process grade | Whether the decision followed the written rules |
| Outcome | Net result expressed in initial-risk units, or R |
Define 1R as the initial planned price risk. In the example above, $20 equals 1R. A $40 gross gain is +2R before costs. Record net outcomes as well, since trading expenses reduce realized returns.
Review screenshots in batches. Look for recurring mistakes such as buying into resistance, misclassifying ranges or changing stops without a predefined reason.
For Al Brooks-style price action practice, the journal should reveal whether your interpretation is becoming more consistent. It should not become a collection of persuasive explanations for every outcome.
Follow a Four-Week Learning Schedule
Treat this as an organizational template, not a deadline for becoming ready to trade live.
| Week | Main task | Deliverable |
|---|---|---|
| 1 | Classify market conditions without placing simulated trades | Annotated charts showing your evidence and uncertainty |
| 2 | Identify one setup, including failed examples | A written setup definition with exclusions |
| 3 | Replay unseen sessions and record every qualifying decision | A complete journal with trades and passes |
| 4 | Freeze the rules and evaluate untouched sessions | A review separating execution mistakes from strategy outcomes |
During the first week, practice distinguishing ranges from trends before studying more entries. Upside’s explanation of price action trading ranges can help clarify why repeated overlap changes how you interpret breakout attempts.
If your setup definition changes in week four, the remaining charts are no longer a clean test of the original rules. Save the revised version and evaluate it on fresh data.
The point of this sequence is to turn trading price action using Al Brooks concepts into observable decisions rather than accumulating terminology.
Evaluate Progress Without Overstating the Evidence
An initial batch of 50 to 100 recorded decisions can expose unclear rules and repeated execution errors. That number is a practice milestone, not statistical proof of profitability. Trades may cluster within the same market conditions and therefore provide less independent information than the count suggests.
Measure rule adherence, average net R, losing streaks, drawdowns and how results change across market conditions. Report how many opportunities you skipped and why.
Win rate alone is insufficient. As a hypothetical example, winning 40% of trades at +2R and losing 60% at -1R produces an average of +0.2R before costs. Average expenses of 0.1R per trade reduce that to +0.1R. Different realized exits can change the result substantially.
Test unchanged rules on previously unseen periods. Repeatedly adjusting parameters to rescue poor results increases the risk of fitting historical noise.
Simulation also cannot reproduce all live conditions, including fill quality and emotional responses. FINRA’s day-trading guidance emphasizes the substantial risks involved. A short profitable simulation is not sufficient justification for leverage or money you cannot afford to lose.
Apply the Concepts Across Markets Carefully
Brooks’ price action framework can be studied on stocks, futures, foreign exchange and crypto charts. Similar-looking patterns do not imply identical trading results.
Stocks have exchange sessions, company announcements and potential overnight gaps. Futures introduce contract specifications, leverage and rollover considerations. Crypto trades continuously, with venue-specific liquidity and fees. Foreign exchange pricing and execution depend on the trading venue or broker.
Lower timeframes create more observations, but spreads, slippage and decision speed can become more consequential relative to the distance between entry and stop. Higher timeframes reduce decision frequency but do not remove gap risk or drawdowns.
When applying Al Brooks concepts to another market or timeframe, start a separate evaluation. Do not assume a setup validated on one instrument transfers unchanged to another.
Frequently Asked Questions
Is Al Brooks’ trading course worth it? Its educational value depends on whether the teaching format improves your understanding and practice. Review available samples and current terms. Testimonials do not establish typical profitability, and buying instruction does not remove trading risk.
Which Al Brooks book should a beginner start with? If your immediate goal is understanding trends and pullbacks, Trading Price Action Trends is a relevant starting point. Trading Ranges and Reversals address different conditions. These are detailed texts, so pair small reading assignments with chart annotation rather than rushing through them.
Are Al Brooks’ strategies mechanical? Much of the framework is discretionary and depends on context. For practice, turn one interpretation into explicit rules. Those rules are your testable implementation, not proof that you have captured the entire method.
Can I practice on daily charts instead of day trading? Yes. Daily charts allow slower analysis, but overnight gaps and longer holding periods require different execution assumptions. Evaluate them separately from intraday examples.
When should I move from replay to real money? There is no universal trade count or timetable. First establish consistent rule adherence, realistic cost assumptions and acceptable results on unseen data. Continuing simulation is appropriate when those conditions remain unclear.
Keep Trading Practice Separate From Portfolio Decisions
A chart setup addresses a possible entry and exit. It does not establish whether a position fits your overall allocation, concentration limits or investment horizon.
Upside Invest provides verified investor holdings, portfolio comparisons and anonymous profiles that can support a separate review of portfolio positioning. Use that information as context, not as confirmation that a short-term chart pattern will succeed.
For your next practice session, choose one unseen chart, write down the market condition and advance one bar at a time. Keep the original decisions intact so you can evaluate what you actually knew.