Price Action Trading Ranges: Entries, Exits, and Risk

Price action trading ranges form when price repeatedly rotates between an area of support and an area of resistance without sustaining movement beyond either boundary. The trading opportunity is straightforward: buy near the lower edge or sell near the upper edge, then exit before the rotation loses room. The difficult part is recognizing when that behavior has stopped.
A useful plan needs more than two horizontal lines. It needs a recognizable range, an entry trigger, a price that invalidates the trade and enough potential reward to justify the risk after execution costs.
Define the range before looking for an entry
Start with the timeframe you intend to trade. A sideways daily chart can contain a strong intraday trend, while a five-minute range may be only a brief pause within a larger selloff. Mark the broader context before drawing your trading boundaries.
Look for three observable features:
- Repeated reactions: Distinct swings have turned near both the upper and lower boundaries. Two reactions at each edge can be a practical starting filter, not proof of a trading advantage.
- Overlapping movement: Price repeatedly retraces prior moves instead of consistently making higher highs and higher lows, or their downward equivalents.
- Usable boundaries: Support and resistance are zones that can be identified before the next trade, rather than lines continually redrawn to fit recent candles.
Include relevant wicks and closing prices when marking those zones. Do not move support lower simply because your planned long entry is losing money.
When are price action trading ranges worth trading?
A recognizable range is not automatically a tradable one. Its width must leave room for an entry, a defensible stop and an achievable target after spreads, fees and slippage.
Suppose a stock fluctuates between approximately $48 and $52. Buying at $50.80 because the chart is “still in a range” leaves little upside before resistance. The same structure may offer a better opportunity closer to support, provided selling pressure actually stalls.
| Condition | More workable setup | Reason to wait |
|---|---|---|
| Entry location | Near a previously identified boundary | Near the midpoint with no clear invalidation |
| Price behavior | Rejection followed by movement back inside | Repeated closes beyond the boundary |
| Trading costs | Small relative to the planned move | Spread consumes much of the potential profit |
| Market context | Stable liquidity and no immediate known catalyst | Earnings or another scheduled announcement is imminent |
Repeated tests do not guarantee that a boundary is becoming stronger. Price pressing against resistance with progressively shallower pullbacks can signal a changing balance. Treat that as a reason to reassess, not an automatic invitation to sell again.
Entry setup 1: Rejection at the boundary
For price action trading ranges, an edge-rejection entry waits for evidence that price has stopped moving outward before committing capital.
For a potential long trade, price reaches the support zone, trades lower and then closes back above part of that zone. One possible trigger is a move above the rejection candle’s high. Another is a subsequent higher low followed by an upward break. Choose one rule in advance so your results are comparable.
The stop belongs where the setup is invalidated, generally beyond the rejection low with enough allowance for ordinary price fluctuation. If that distance makes the trade unattractive, reduce position size or skip it. Moving the stop closer solely to manufacture a better reward-to-risk ratio changes the setup.
Buying with a limit order at support may produce a lower entry price, but it also enters before rejection is established. Waiting for confirmation generally sacrifices some entry price and can miss the trade entirely. Neither approach removes uncertainty.
For a short trade at resistance, reverse the logic. Short selling adds borrow availability, borrowing costs and potentially unlimited loss, so it is not a direct substitute for a long trade in a cash account.
Entry setup 2: A failed breakout back into the range
A failed breakout occurs when price moves outside a boundary but cannot sustain that move. In price action trading ranges, this creates a different entry opportunity from buying the first touch of support.
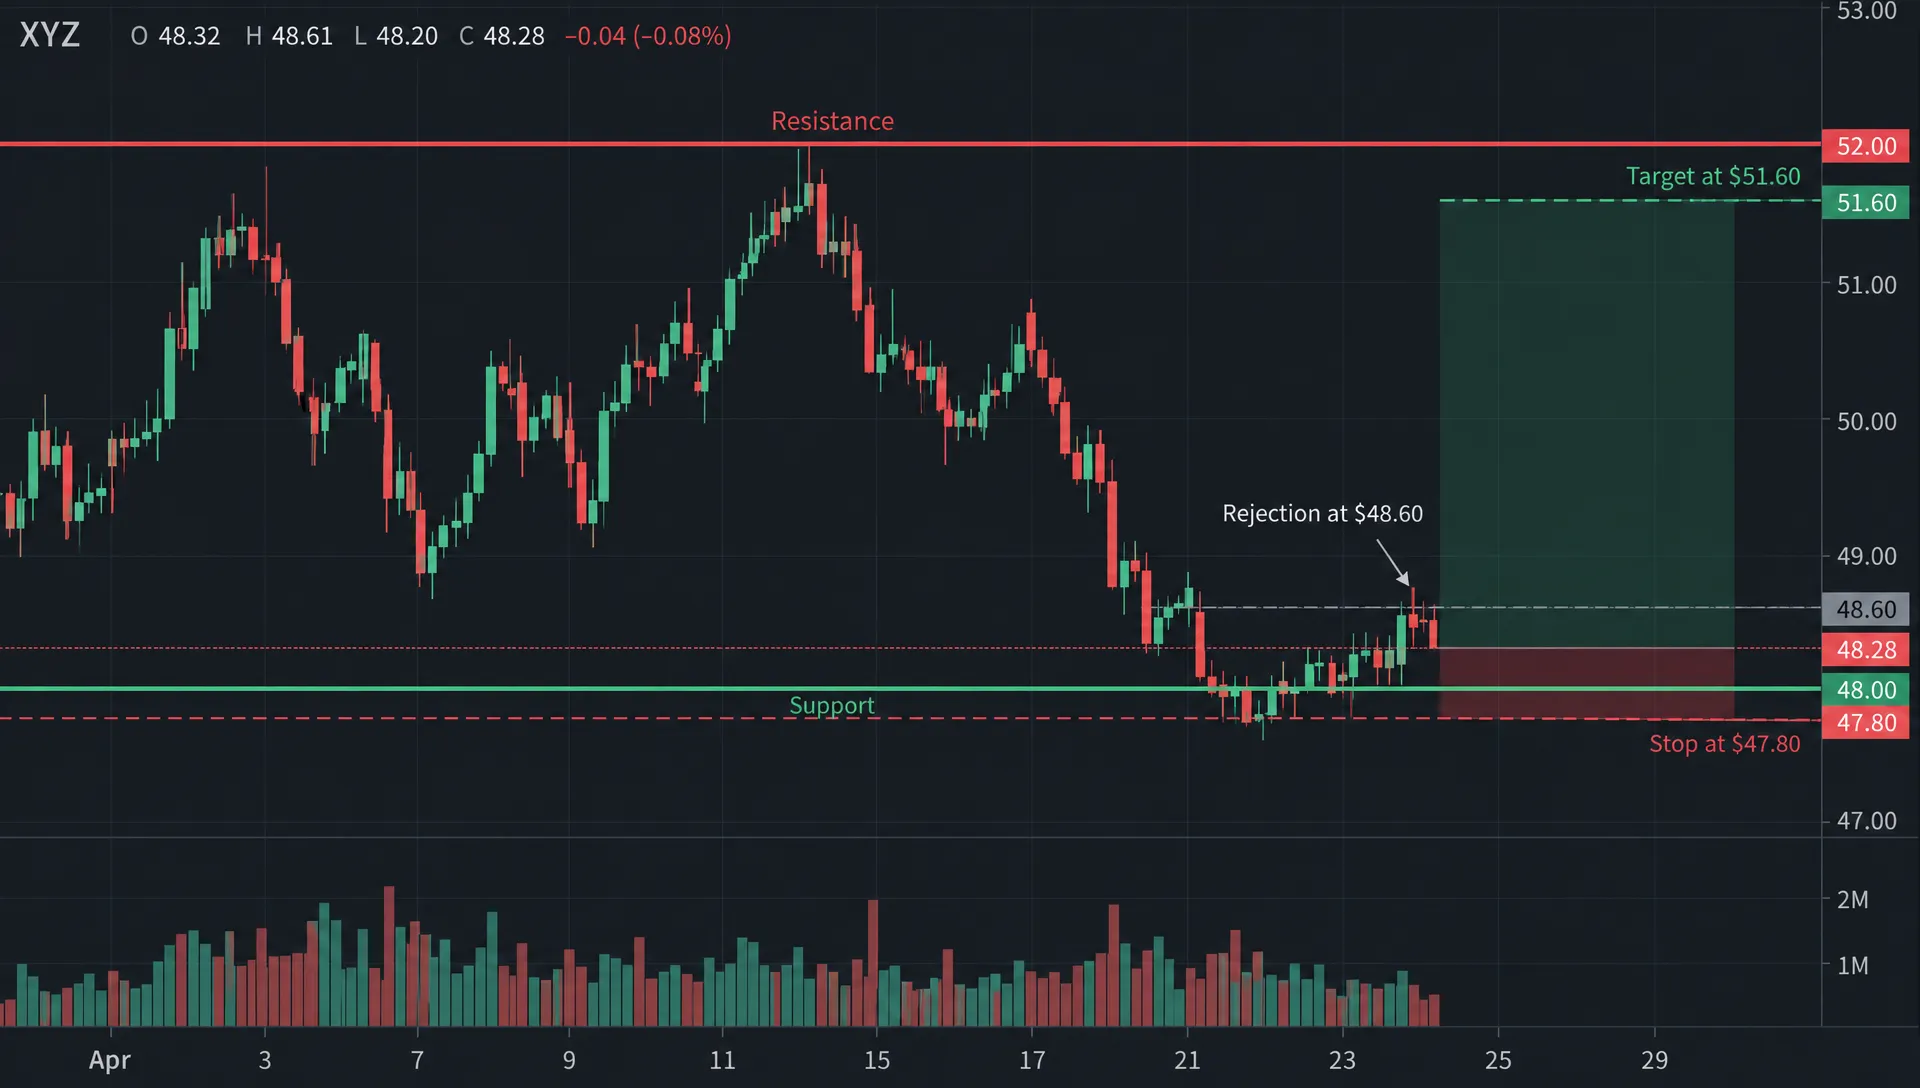
For example, price drops below the established $48 support zone, then closes back inside the range. A trader could require a subsequent pullback that holds above the excursion low before entering. The stop would sit beyond the failure point, not at an arbitrary percentage below the entry.
Do not assume every brief move outside a range is a stop hunt. A wick does not reveal who traded or why. The useful evidence is observable: price returned inside, a predefined trigger appeared and the distance to the target still supports the trade.
If price instead remains outside the boundary and begins holding there, the failed-breakout thesis has not developed. Waiting is a valid outcome.
Also check the larger timeframe. A bounce within a steep decline may be a countertrend trade that needs stronger reversal evidence, rather than a neutral rotation between balanced buyers and sellers.
Plan exits around available room
Exits for price action trading ranges should reflect the structure that justified the entry. A range trade normally targets a rotation within established boundaries, not an unlimited trend move.
Three reference points matter: the invalidation level, the midpoint and the opposite boundary. The midpoint can be a conservative profit-taking area, especially if prior swings repeatedly stalled there. A target slightly before the opposite resistance zone avoids relying on an exact touch, although it cannot guarantee execution.
Partial exits involve a real trade-off. Selling half a long position at the midpoint reduces exposure, but it also reduces the average payoff if the remaining shares reach resistance. Evaluate the blended result rather than advertising only the furthest target’s reward-to-risk ratio.
A time-based exit can also be useful. For an intraday strategy, you might close before the session ends or exit if price fails to rotate within a predefined number of bars. Those are rules to test, not universal requirements.
Avoid automatically moving the stop to breakeven after a small favorable move. Ordinary range noise may revisit the entry before reaching the target. Any stop adjustment should belong to the tested plan.
Size the position from the planned loss
The main risk control for price action trading ranges is position size based on invalidation, not confidence that support will hold.
Start with a dollar loss budget you can afford within your overall portfolio. Then calculate the number of shares from the distance between entry and stop, allowing for expected execution costs:
Position size = dollar risk budget ÷ estimated loss per share.
For a long trade, estimated loss per share starts with entry price minus stop price. Add an allowance for applicable fees, spread and slippage without double-counting costs already reflected in the assumed fills. Round down to whole shares if fractional execution is unavailable.
This calculation estimates risk; it does not cap the loss. As Investor.gov explains in its order-type guidance, a stop order becomes a market order when triggered, and its execution price can differ substantially from the stop price. A stop-limit order controls the acceptable execution price but may not execute.
Gaps, trading halts and thin liquidity can therefore produce losses beyond the budget. Leverage increases the consequences. Several correlated positions can also fail together, even when each position appears small in isolation.
Worked example: A $48 to $52 range
The following hypothetical example shows how price action trading ranges connect entry location, exit planning and account exposure. It is an illustration, not a recommended trade or risk allocation.
Assume an $80,000 account with a chosen risk budget of 0.25%, or $200. A long entry triggers at $48.60 after support rejection, with a stop at $47.80 and a target at $51.60, before the resistance zone.
| Input | Calculation or value |
|---|---|
| Entry-to-stop distance | $48.60 − $47.80 = $0.80 per share |
| Assumed total execution-cost allowance | $0.10 per share |
| Estimated loss per share | $0.90 |
| Position size | $200 ÷ $0.90, rounded down = 222 shares |
| Capital committed | 222 × $48.60 = $10,789.20 |
| Estimated planned loss | 222 × $0.90 = $199.80 |
| Gross target profit | 222 × $3.00 = $666 |
Using the same $0.10 total cost allowance, estimated target profit becomes $643.80. That is approximately 3.22 times the estimated planned loss, often written as 3.22R. Actual fills can change both figures.
Notice that the position uses about 13.5% of the account’s capital despite budgeting only 0.25% for the planned loss. Capital exposure and stop-based risk are different measurements. Both matter when evaluating gaps and portfolio concentration.
Recognize when the range stops being the right framework
A strategy for price action trading ranges needs an explicit suspension rule. Otherwise, repeated failed fades can turn a previously useful chart into a series of avoidable losses.
Possible warning signs include expanding directional candles, repeated closes beyond a boundary and pullbacks that hold outside the former range. None proves a new trend will persist. Together, they weaken the case for continuing to trade rotations inside the old structure.
Choose an operational rule before the session. For example, you might suspend range entries after two consecutive closes outside the boundary on your execution timeframe. That is a testable convention, not a universally reliable signal. Another strategy might require an outside close followed by a successful retest.
Do not immediately reverse every stopped-out long into a short. Being wrong about support does not establish a profitable downside entry. A transition to directional trading requires a separate stock trend trading plan with its own entry and sizing rules.
Scheduled earnings, major economic releases or abrupt liquidity changes can also invalidate the conditions behind the range. Standing aside avoids pretending yesterday’s boundaries remain equally relevant.
Test the setup without hindsight
Historical charts make price action trading ranges look cleaner than they felt in real time. Once the outcome is visible, it is easy to choose perfect boundaries and ignore ambiguous trades.
Record the support zone, resistance zone, timeframe and entry rule before taking the trade. Keep a screenshot of the original boundaries. If you redraw them, preserve the earlier version so your review does not quietly replace losing setups with better-looking ones.
Track edge-rejection trades separately from failed-breakout trades. Also distinguish long and short results, time of day, holding period and whether a scheduled announcement was nearby. Different setups can behave differently even when they share the same chart boundaries.
Measure outcomes after costs in units of initial planned risk. A useful summary is:
Expectancy = (win rate × average win) − (loss rate × average loss).
Express average wins and losses in the same units, and do not subtract costs again if they are already included. A high win rate can still lose money when occasional losses are much larger than typical gains.
A favorable reward-to-risk ratio alone does not establish positive expectancy. Paper trading can help test rule consistency, but simulated fills may be more favorable than live execution.
Frequently asked questions
Which timeframe works best for range trading? There is no universal best timeframe for price action trading ranges. Shorter charts generally make spreads and execution quality more significant relative to the available move. Longer charts introduce more overnight exposure. Choose a timeframe you can monitor and test it separately from others.
Should I buy support as soon as price touches it? Only if an immediate limit entry is part of your predefined strategy. Waiting for rejection or a failed downside breakout adds confirmation, but often produces a higher entry price. Compare both approaches after costs rather than assuming confirmation always improves results.
Can I trade without indicators? Yes. Candles, swing points and support and resistance zones can define the setup. Indicators are optional measurements, not substitutes for an entry trigger or invalidation rule.
Is a narrow range safer than a wide range? Not necessarily. A narrow range can leave too little potential profit after trading costs. A wide range requires a smaller position for the same dollar risk when its stop distance is larger. Gap risk remains in either case.
Keep the trade separate from the portfolio
A well-defined setup can still add unwanted concentration to your account. Before entering, review existing exposure to the same company, sector and broader market drivers.
Use Upside Invest’s portfolio comparison tools to compare allocations with verified investor holdings and explore sector exposure. That context can support portfolio decisions, but another investor’s position does not validate your entry. Your trade still needs its own trigger, exit and loss budget.