Stock Trend Trading With Entries, Exits, and Position Sizing

A stock trend trading plan should define the trend you want, the entry that makes the risk acceptable, the exit that proves you are wrong and the position size that keeps one trade from dominating your account. Without those four pieces, a trend setup can look disciplined on a chart yet behave like a guess once real money is involved.
This guide focuses on the practical middle ground between passive investing and short-term chart chasing. It is not a promise that a moving average, breakout or ranking system will beat the market. It is a framework for making consistent decisions, reviewing them honestly and avoiding the most common mistake in trend strategies: letting conviction replace risk control.
Stock Trend Trading Starts With a Complete Trade Plan
Trend strategies exist because markets can persist in one direction longer than many investors expect. Narasimhan Jegadeesh and Sheridan Titman documented the momentum effect in their 1993 paper on buying recent winners and selling recent losers. In practice, though, knowing that trends can persist is not enough. You still need rules for when to act, when to step aside and how much capital to commit.
A practical stock trend trading process has five separate parts. Each part answers a different question, so they should not be mixed together.
| Plan component | Question it answers | Example |
|---|---|---|
| Trend filter | Is this stock in a tradable trend? | Price above a rising 200-day moving average |
| Entry trigger | Where does the setup become actionable? | Breakout above resistance or pullback reclaiming support |
| Invalidation point | Where is the trade thesis wrong? | Close below prior swing low or volatility stop |
| Position size | How many shares fit the risk limit? | Dollar risk divided by stop distance |
| Exit method | How are profits or losses handled? | Trailing stop, target zone or time stop |
Trend filters are not entries
A trend filter tells you whether a stock is worth monitoring, not whether you should buy immediately. A stock can be in an uptrend and still be extended, illiquid or too close to earnings for your strategy. A simple filter might require price above a rising 50-day and 200-day moving average, improving relative strength versus the market and a healthy industry group.
In stock trend trading, the filter keeps you aligned with the larger move, but the entry trigger controls price and risk. Traders who confuse the two often buy because the chart looks strong, then discover that the nearest logical stop is so far away that the position cannot be sized responsibly.
If you want a deeper review of the tools that help separate trend quality from noise, Upside Invest has a useful breakdown of technical trend indicators traders actually use, including moving averages, relative strength, ATR and breadth.
Step 1: Define the Trend You Are Willing to Trade
A trend definition should be objective enough that two people looking at the same chart reach the same conclusion. For a medium-term trader, that might mean a 3-month high, higher highs and higher lows, price above the 50-day moving average and the 50-day above the 200-day. For a longer-term investor, the definition may lean more on weekly charts, revenue momentum, sector leadership and ownership trends.
You do not need ten indicators. You need enough evidence to avoid buying random strength. A clean trend usually has rising price, improving relative performance and enough volume or participation to suggest that demand is not coming from one isolated news day.
A stock trend trading watchlist becomes more useful when every name is there for a specific reason. Label each candidate by trend type: fresh breakout, orderly pullback, relative strength leader, post-earnings continuation or sector rotation. That label helps you choose an entry style instead of applying the same trigger to every chart.
Add market and sector context
Even strong individual stocks struggle when the broad market is deteriorating. Before taking a new trend trade, check whether the major indexes are above key moving averages, whether market breadth is improving and whether the stock's sector is attracting capital. Sector context matters because many trends are not purely company specific. Software, energy, biotech and semiconductors often move in clusters.
This is also where portfolio data can improve your process. If verified investors are accumulating a theme while price and relative strength are improving, that does not make the trade safe, but it can confirm that the move is not purely retail enthusiasm.
Step 2: Build Entries That Do Not Chase
Entries should give you an attractive relationship between upside potential and downside risk. The cleanest setups usually occur at points where the market has already revealed a level that matters, such as a prior high, consolidation range, moving average or pullback low.
Good stock trend trading entries are less about buying the lowest tick and more about buying at a place where invalidation is clear. If the stop is vague, the trade will be hard to size. If the stop is too wide, the position may be too small to matter or too large for the account.
| Entry type | Best used when | Common risk |
|---|---|---|
| Breakout | Price clears a well-tested resistance area with volume | Buying a false breakout after a crowded move |
| Pullback | Stock remains in an uptrend but retraces toward support | Buying weakness that is actually trend failure |
| Reclaim | Price briefly loses a level then recovers quickly | Entering before the recovery is confirmed |
| Post-earnings continuation | Gap or surge holds after a major catalyst | Chasing after the best risk point has passed |
Breakout entries
A breakout entry works when price moves above a range that previously capped the stock. The better setups usually have a base that lasted long enough to shake out impatient holders, followed by expansion in volume and relative strength. The stop can sit below the breakout level, the midpoint of the base or the most recent swing low, depending on timeframe.
Avoid breakouts that are already far above their base. If a stock has moved 15% in three sessions before your entry, the chart may still trend higher, but your risk location is probably poor.
Pullback entries
A pullback entry waits for a trending stock to retreat toward a support zone. This can improve risk because the stop may sit closer to the entry. The tradeoff is that pullbacks sometimes mark the beginning of a deeper reversal.
Look for pullbacks that occur on lighter volume, hold above a prior swing low and show buyers returning before price reaches obvious resistance. A pullback that slices through multiple support levels is not a discount. It is a warning.
Step 3: Set Exits Before You Enter
Exits are easier to design before emotions are involved. Once a position is profitable, greed makes it hard to sell. Once it is losing, hope makes it hard to accept the signal. Your exit rules should be written before the trade opens.
In stock trend trading, exits usually fall into three groups: initial stops, trailing stops and profit management rules. Initial stops protect capital when the setup fails quickly. Trailing stops protect gains while giving the trend room to continue. Profit rules help reduce exposure when a move becomes extended or reaches a preplanned target.
Initial stops define invalidation
An initial stop should sit at the point where your reason for entering is no longer valid. For a breakout, that may be a close back inside the old range. For a pullback, it may be below the pullback low. For a volatility-based stop, many traders use a multiple of ATR so normal price movement does not trigger an exit too easily.
Stops should not be placed where everyone else is obvious if the chart gives a better technical level nearby. They should also not be moved farther away because the trade is losing. If new information proves the setup wrong, reducing risk is usually better than negotiating with the chart.
Trailing exits let winners breathe
A trailing exit is designed to stay with the move while the trend is intact. Common versions include a close below the 20-day or 50-day moving average, a break of a rising trendline, a lower high after a failed breakout or an ATR trail that follows volatility.
There is no perfect trail. A tight trail protects more open profit but exits more often. A loose trail captures larger trends but gives back more along the way. The right choice depends on your holding period, tax situation, account size and tolerance for drawdowns. For a more risk-centered treatment, see Upside Invest's guide to technical trend trading rules for managing risk.
Step 4: Size the Position From Risk, Not Conviction
Position sizing is where a good idea becomes either a controlled trade or an account-level problem. The mistake is sizing by excitement: bigger for favorite stocks, smaller for boring setups. A better approach starts with the maximum dollar amount you are willing to lose if the stop is hit.
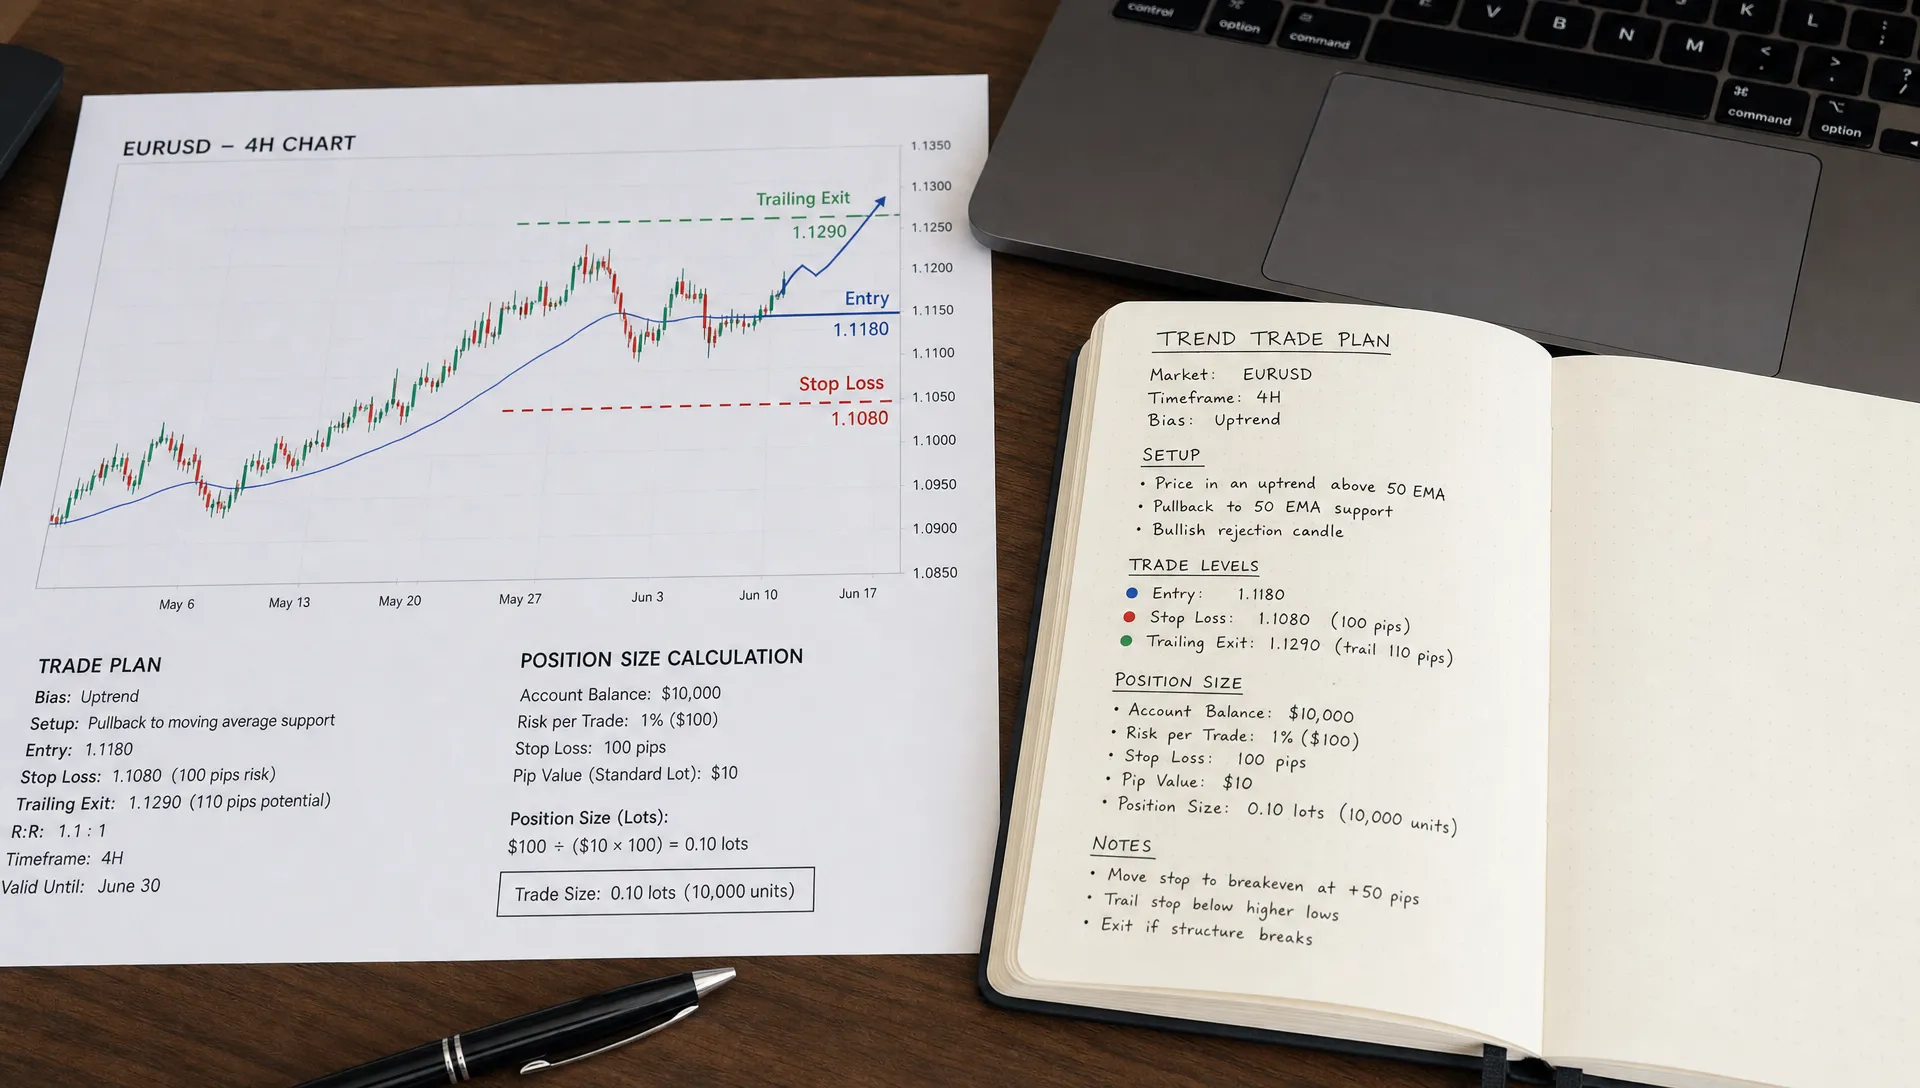
For stock trend trading, the simplest sizing formula is: position size equals account risk dollars divided by the distance between entry and stop. If your account is $50,000 and you risk 0.75% on one trade, the dollar risk is $375. If your entry is $80 and your stop is $75, the stop distance is $5, so the maximum size is 75 shares before commissions and slippage.
| Account equity | Risk per trade | Entry | Stop | Dollar risk | Max shares |
|---|---|---|---|---|---|
| $50,000 | 0.75% | $80 | $75 | $375 | 75 |
| $50,000 | 0.75% | $40 | $36 | $375 | 93 |
| $50,000 | 0.50% | $120 | $112 | $250 | 31 |
Adjust size for volatility and correlation
Two trades with the same dollar risk can still behave differently. A biotech stock waiting on trial data, a levered crypto proxy and a stable large-cap industrial do not carry the same gap risk. If a stock is prone to overnight gaps, has earnings tomorrow or trades in a highly correlated theme you already own, reduce size or skip it.
Account-level exposure matters too. Five semiconductor positions may look like five separate trades, but they can behave like one large sector bet. Limit total exposure by sector, theme and factor. If several positions depend on the same macro condition, such as falling yields or rising oil prices, treat that shared dependency as real risk.
Step 5: Fit the Trade to Your Portfolio and Life
A trading plan that ignores cash needs is incomplete. You may have a strong setup, but if the capital might be needed soon, the position should be smaller or avoided. Rent, tuition, taxes, medical costs and family obligations are not side issues. They shape how much volatility you can actually tolerate.
A stock trend trading system should work inside a broader financial plan, not compete with it. For example, an investor helping a parent maintain independence may need to reserve cash for caregiving, transportation or local services such as home care support in Espoo and Turku. Those real-world commitments can matter more than the next chart pattern when deciding account risk.
Use verified behavior as a second lens
Price is the primary signal in trend trading, but portfolio behavior can add context. If a stock is breaking out while verified investors with strong risk-adjusted records are increasing exposure, the setup may deserve closer study. If price is rising while experienced holders are reducing positions, that does not automatically invalidate the trade, but it should make you ask what the market may already be pricing in.
On Upside Invest, investors can compare anonymous verified holdings, monitor trend and momentum data, review top performer rankings and benchmark allocations without exposing their identity. That kind of context is useful because trend trades often fail when the visible chart looks strong but ownership has become too crowded.
Common Mistakes That Hurt Trend Traders
The most expensive stock trend trading mistakes usually come from inconsistency rather than one bad indicator. A trader buys breakouts one week, pullbacks the next, moves stops after losses, then judges the strategy after a small sample of unrelated decisions.
| Mistake | Why it hurts | Better rule |
|---|---|---|
| Buying because a stock is up | Strength alone does not define risk | Require a trend filter and entry trigger |
| Moving stops lower | Losses can grow beyond the plan | Stop level changes only when risk is reduced |
| Oversizing tight stops | Small noise becomes a large account hit | Size from dollar risk and realistic volatility |
| Ignoring earnings | Gap risk can bypass stops | Reduce size or wait until after the event |
| Adding to losers | The market is rejecting the thesis | Add only after strength confirms the trend |
Review trades by rule, not outcome
A profitable trade can still be poorly executed, and a losing trade can be correct if it followed the plan. Review each trade by whether the trend filter, entry, stop, size and exit matched your rules. Over time, this helps you improve the process instead of overreacting to the last result.
Keep screenshots of the setup at entry, during management and at exit. Note whether you followed the plan, where slippage occurred and whether the trade was correlated with other holdings. After 30 to 50 trades, patterns become clearer.
A Simple Trade Plan Template
Before placing a trend trade, write the answers in plain language. If you cannot fill in the template, the setup is not ready.
- Trend filter: The stock is in an uptrend because price, relative strength and market context meet my rules.
- Entry trigger: I will enter only if price confirms the planned breakout, pullback or reclaim.
- Invalidation: I will exit if price closes below the specific level that breaks the setup.
- Position size: I will risk no more than my preset percentage of account equity.
- Trade management: I will trail the stop or take partial profits using the rule chosen before entry.
- Portfolio check: I will confirm the trade does not create excessive sector, theme or single-stock exposure.
This template may feel basic, but that is the point. Complex systems often fail because the trader cannot execute them under pressure. A written plan reduces the number of decisions you make while the market is moving.
Frequently Asked Questions
Is stock trend trading the same as momentum investing? They overlap, but they are not identical. Momentum investing often ranks assets by recent performance, while stock trend trading usually combines price trend, entry timing, stop placement and position sizing into a trade plan.
What moving average is best for trend trades? There is no universal best moving average. The 20-day, 50-day and 200-day averages are common because they represent different timeframes, but the right choice depends on holding period and volatility.
How much should I risk on one trend trade? Many traders keep risk per trade small, often below 1% of account equity, but the right number depends on account size, experience, liquidity needs and the number of correlated positions already held.
Should I take profits quickly or use a trailing stop? Quick profit-taking can improve win rate but may cut off the biggest winners. Trailing stops can capture larger moves, but they require accepting givebacks. Choose the exit style before entry and apply it consistently.
Can portfolio data improve trend trading decisions? Yes, when used as context rather than a blind signal. Verified investor holdings, allocation changes and risk-adjusted performance can help confirm whether a trend has institutional-quality support or may be getting crowded.
Turn Trend Signals Into Better Portfolio Decisions
A chart can tell you where price has been, but it cannot show how your portfolio compares with other verified investors or whether your exposures are becoming crowded. Upside Invest helps connect trend signals with real portfolio context through anonymous verification, allocation benchmarking, trend tracking, return metrics, Sharpe metrics and alerts on investor moves.
Use the framework above to define the trade. Then use better data to decide whether the opportunity deserves capital, how it fits your portfolio and when the evidence has changed.