How to Screen for Trending Forex Pairs Before Trading
Screening for trending forex pairs means separating persistent price movement from a one-day spike, an expensive trade or a crowded currency bet. The goal is not to find the biggest mover and immediately place an order. It is to build a short, comparable watchlist that deserves further analysis.
A useful screen answers four questions: Is the move directional? Is it persistent? Can you trade it at an acceptable cost? Does it add a different exposure from positions you already hold? This workflow addresses those questions without pretending to provide live market rankings.
Set the timeframe before comparing pairs
Start with your intended holding period, then choose the chart interval that will drive the screen. A daily-chart trend may be irrelevant to a trade you intend to close within an hour. Conversely, a sharp five-minute move may be noise within a weekly range.
For a concrete research template, use four-hour candles, a 20-bar measurement window and a 14-period Average True Range (ATR). These are example settings to test, not an optimized trading system.
Use completed candles throughout. Comparing a finished candle for one pair with a still-forming candle for another produces an inconsistent ranking. Keep the quote source, candle boundaries and screening timestamp consistent as well.
Write down the settings before looking at results. Changing the lookback until a favorite pair reaches the top defeats the purpose of screening.
Build a trending forex watchlist with comparable data
Begin with a manageable universe. The seven commonly traded major pairs, EUR/USD, USD/JPY, GBP/USD, USD/CHF, AUD/USD, USD/CAD and NZD/USD, provide a practical starting point. Add crosses only when your data source and broker provide usable quotes during your intended trading session.
A larger universe is not automatically better. Thinly traded pairs can show dramatic moves while offering wide spreads, uneven execution or substantial overnight costs.
Before calculating anything, check for missing candles, stale quotes and unusual price spikes. Spot forex is decentralized, so broker feeds can differ. A ranking built from inconsistent feeds may reflect data construction rather than a meaningful market difference.
Keep quote direction straight. Rising EUR/USD means the euro is strengthening against the dollar. Rising USD/JPY means the dollar is strengthening against the yen. A positive return does not mean the same underlying currency is strong across every pair.
Your initial watchlist should therefore be a fixed research universe, not a collection of whatever appeared on a “top movers” panel that morning.
Apply hard filters before ranking candidates
A trending forex screen should reject unsuitable conditions before awarding momentum scores. Otherwise, an impressive chart can distract you from costs or event exposure that would have ruled the trade out immediately.
| Filter | What to check | Reason to remove or pause a pair |
|---|---|---|
| Data quality | Fresh quotes and complete candles | Missing observations or unexplained spikes |
| Execution cost | Spread, commission and likely slippage | Costs exceed your predefined allowance |
| Event exposure | Scheduled releases affecting either currency | An event falls inside your restricted entry window |
| Trading session | Conditions when you can actually trade | Quotes or execution are unsuitable during that session |
| Holding cost | Broker rollover terms for the intended direction | Financing materially weakens the proposed trade |
Measure costs against the trade you might take, not just against other pairs. A 1.2-pip spread is 4% of a proposed 30-pip stop distance, before commission or slippage. The same spread consumes 15% of an eight-pip stop distance.
Set event restrictions in advance and test them. A central-bank announcement can invalidate an otherwise clean ranking, while unscheduled news remains a risk even when the calendar looks quiet.
Rank movement and persistence separately
Once unsuitable pairs are removed, compare two different characteristics: how far price has traveled relative to its usual movement and how direct that path has been. A trending forex candidate should not qualify solely because its latest candle was large.
Normalize the size of the move
Raw pip changes are poor cross-pair ranking tools because quotation conventions and volatility differ. Percentage returns improve comparability, but they still do not account for each pair’s recent trading range.
One simple research measure is:
Normalized move = (latest completed close − close 20 bars earlier) ÷ current 14-period ATR.
Use the same price units in the numerator and denominator. Keep the sign to identify direction and use the absolute value when comparing movement size.
A reading of +2 means the net advance equals twice the current ATR. It does not mean a two-standard-deviation event, a particular probability of continuation or a buy signal. ATR measures range, not expected return.
Measure how directly price traveled
A pair can finish higher after repeatedly reversing along the way. To distinguish that behavior from a more persistent move, calculate directional efficiency:
Directional efficiency = absolute net close-to-close change ÷ sum of absolute individual close-to-close changes over the same window.
The result ranges from zero to one when the denominator is positive. Higher values indicate a more direct path. If the denominator is zero, flag the observation rather than dividing by zero.
For an explicit research starting point, test an absolute normalized move of at least 2 and efficiency of at least 0.30. These thresholds are illustrative, not validated recommendations.
Inspect qualifying charts afterward. A single news jump can produce impressive readings without a sustained sequence of tradable swings. For that chart-level check, review how to identify a trending market in forex, rather than adding several overlapping indicators to the screen.
Check higher-timeframe context and shared currency risk
Before promoting a trending forex candidate, inspect one higher timeframe. Record whether it supports the direction, is neutral or presents an obvious conflict, such as a major range boundary immediately ahead. Apply the same classification rules to every pair.
Next, group candidates by their underlying currency exposure. Long USD/JPY and long USD/CHF both include a long-dollar position. Short EUR/USD adds another dollar-positive exposure, even though its chart points downward.
These trades are not identical, but counting them as three independent ideas understates their common risk. A dollar-specific reversal could affect all three together.
Choose the cleaner expression of the idea or explicitly limit combined exposure. Position sizing should reflect the loss across the group if the shared currency thesis fails, not just the stop distance on each individual ticket. Historical correlations can help, but they change and should not replace this basic exposure check.
Work through a hypothetical shortlist
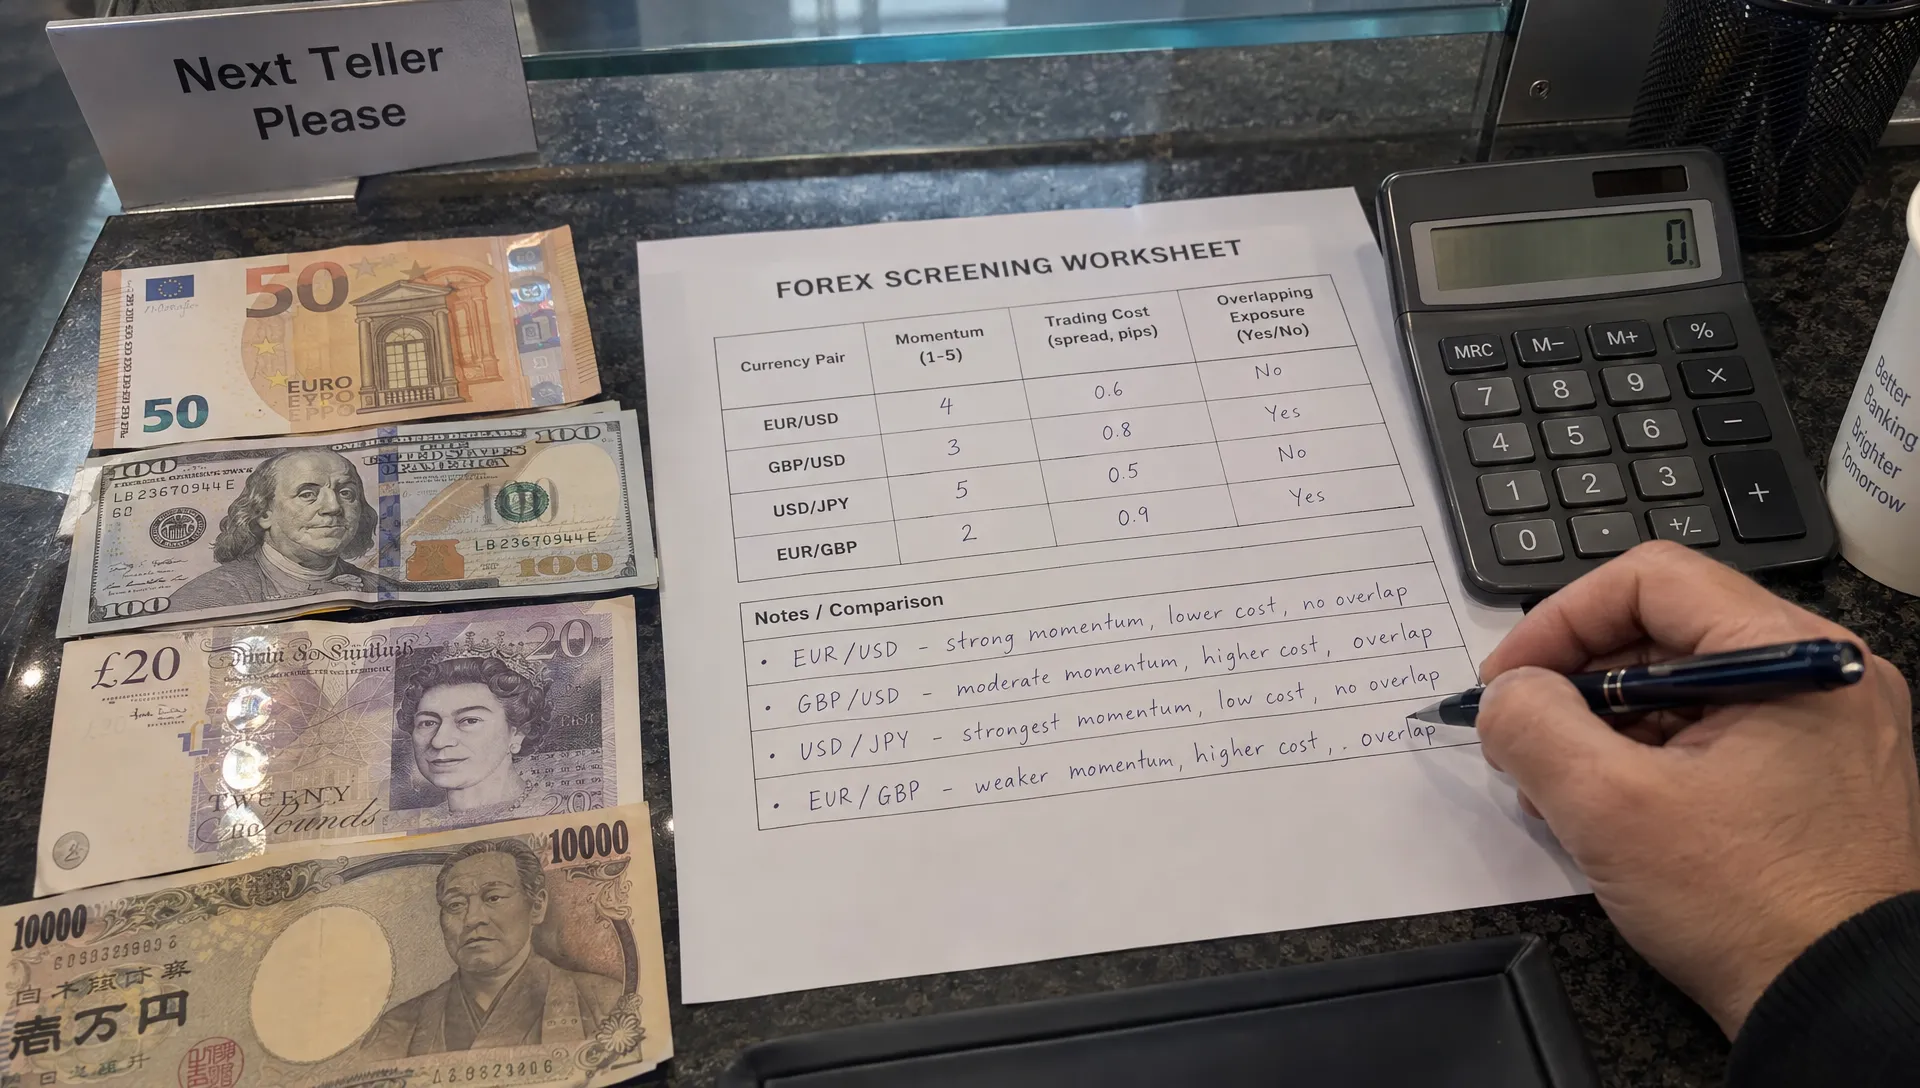
The following figures are invented solely to demonstrate the process. They are not current market observations. Assume the data, execution-cost and event filters have already passed, and apply the illustrative thresholds above.
| Pair | Signed normalized move | Directional efficiency | Screening result |
|---|---|---|---|
| EUR/USD | -2.4 | 0.46 | Qualifies for chart review |
| GBP/USD | -2.1 | 0.40 | Qualifies, but shares dollar exposure |
| AUD/JPY | +2.7 | 0.22 | Reject, insufficient persistence |
| USD/CHF | +0.7 | 0.12 | Reject, insufficient movement and persistence |
AUD/JPY has the largest normalized move, yet fails the persistence rule. That is precisely why ranking only the biggest movers is inadequate.
EUR/USD and GBP/USD both qualify, but short positions in both would express partly overlapping dollar strength. You might retain just one after comparing higher-timeframe obstacles, execution costs and the distance to a defensible invalidation level.
The output of a trending forex screen is therefore a research shortlist, not a set of orders. A qualifying pair still needs a defined entry condition, an invalidation point and a position size consistent with your risk limit. If those cannot be specified, the pair stays on watch.
Separate price trends from online attention
A “trending” label may refer to price momentum, trading activity, news coverage or search popularity. Check which one a tool actually measures before using its rankings.
Google Trends can help explain why a currency topic is attracting attention. This overview of Google Trends and search-interest patterns discusses emerging interest, seasonality and geographic differences. Those are useful dimensions of public attention, not evidence that a currency is being accumulated or that a price move will continue.
Likewise, broker tick volume reflects activity in that feed, not a consolidated count of all global spot forex transactions. Social mentions can increase after a move is already extended.
Use attention data to generate research questions, such as which announcement attracted interest. Keep it separate from the price, cost and risk rules that determine whether a pair qualifies.
Save every screening decision, including rejections
A repeatable trending forex process needs an audit trail. Save the timestamp, data source, settings, metric values and reason each pair passed or failed. Record the spread available when you could actually have entered, not a favorable spread observed hours later.
Assign clear statuses such as rejected, watching, entry-ready or invalidated. This prevents a watchlist candidate from quietly becoming a trade without the remaining checks.
Then evaluate the complete decision process. Track false positives, missed moves, trading costs and results from any predefined entry and exit rules. A screen by itself cannot produce a meaningful strategy return because it does not specify when or how trades occur.
If an MT4 dashboard supplies the rankings, check whether historical signals change after candles close. The workflow for testing a trend meter indicator before trading covers repainting, realistic costs and out-of-sample evaluation.
Freeze your rules during each evaluation period. After any revision, test on unused data and then in a demo environment. Optimizing thresholds against the same history repeatedly can produce a convincing ranking that fails in practice.
Frequently asked questions
Which forex pairs are trending right now? A reliable answer requires timestamped prices, a defined timeframe and stated screening rules. There is no single permanent list. A pair can trend on a four-hour chart while remaining inside a daily range, so check live data against your chosen horizon.
What is the best indicator for finding trending forex pairs? No indicator is universally best. A practical screen can combine ATR-normalized movement with directional persistence, then apply cost, calendar and exposure checks. Adding more indicators is useful only if testing shows that they improve decisions rather than repeat the same information.
Should I buy the pair at the top of the ranking? No. Rank indicates how well a pair matches the screen, not whether the current price offers an acceptable entry. A highly ranked pair may be extended, near resistance or unsuitable once execution costs and stop placement are considered.
Can this process guarantee $100 a day? No. Screening cannot guarantee daily income. Results depend on capital, leverage, execution, entry and exit rules, costs and market conditions. Increasing leverage to meet a daily dollar target can increase losses just as quickly as gains.
Keep portfolio context separate from execution signals
Currency positions can add exposures that are easy to overlook when reviewing investments one account at a time. For broader allocation research, Upside Invest offers portfolio comparison using verified investor holdings and private, anonymous profiles.
Use that context to examine concentration and learn from other allocations. Use dedicated forex data, a tested screening process and explicit risk limits to decide whether a currency trade belongs in your portfolio.