What Is the Best Indicator for Stock Direction?
The best indicator for stock direction depends on whether you want to identify an existing trend, time an entry or estimate a company’s longer-term prospects. Those are different jobs. A signal that helps an intraday trader can be largely irrelevant to someone investing for five years.
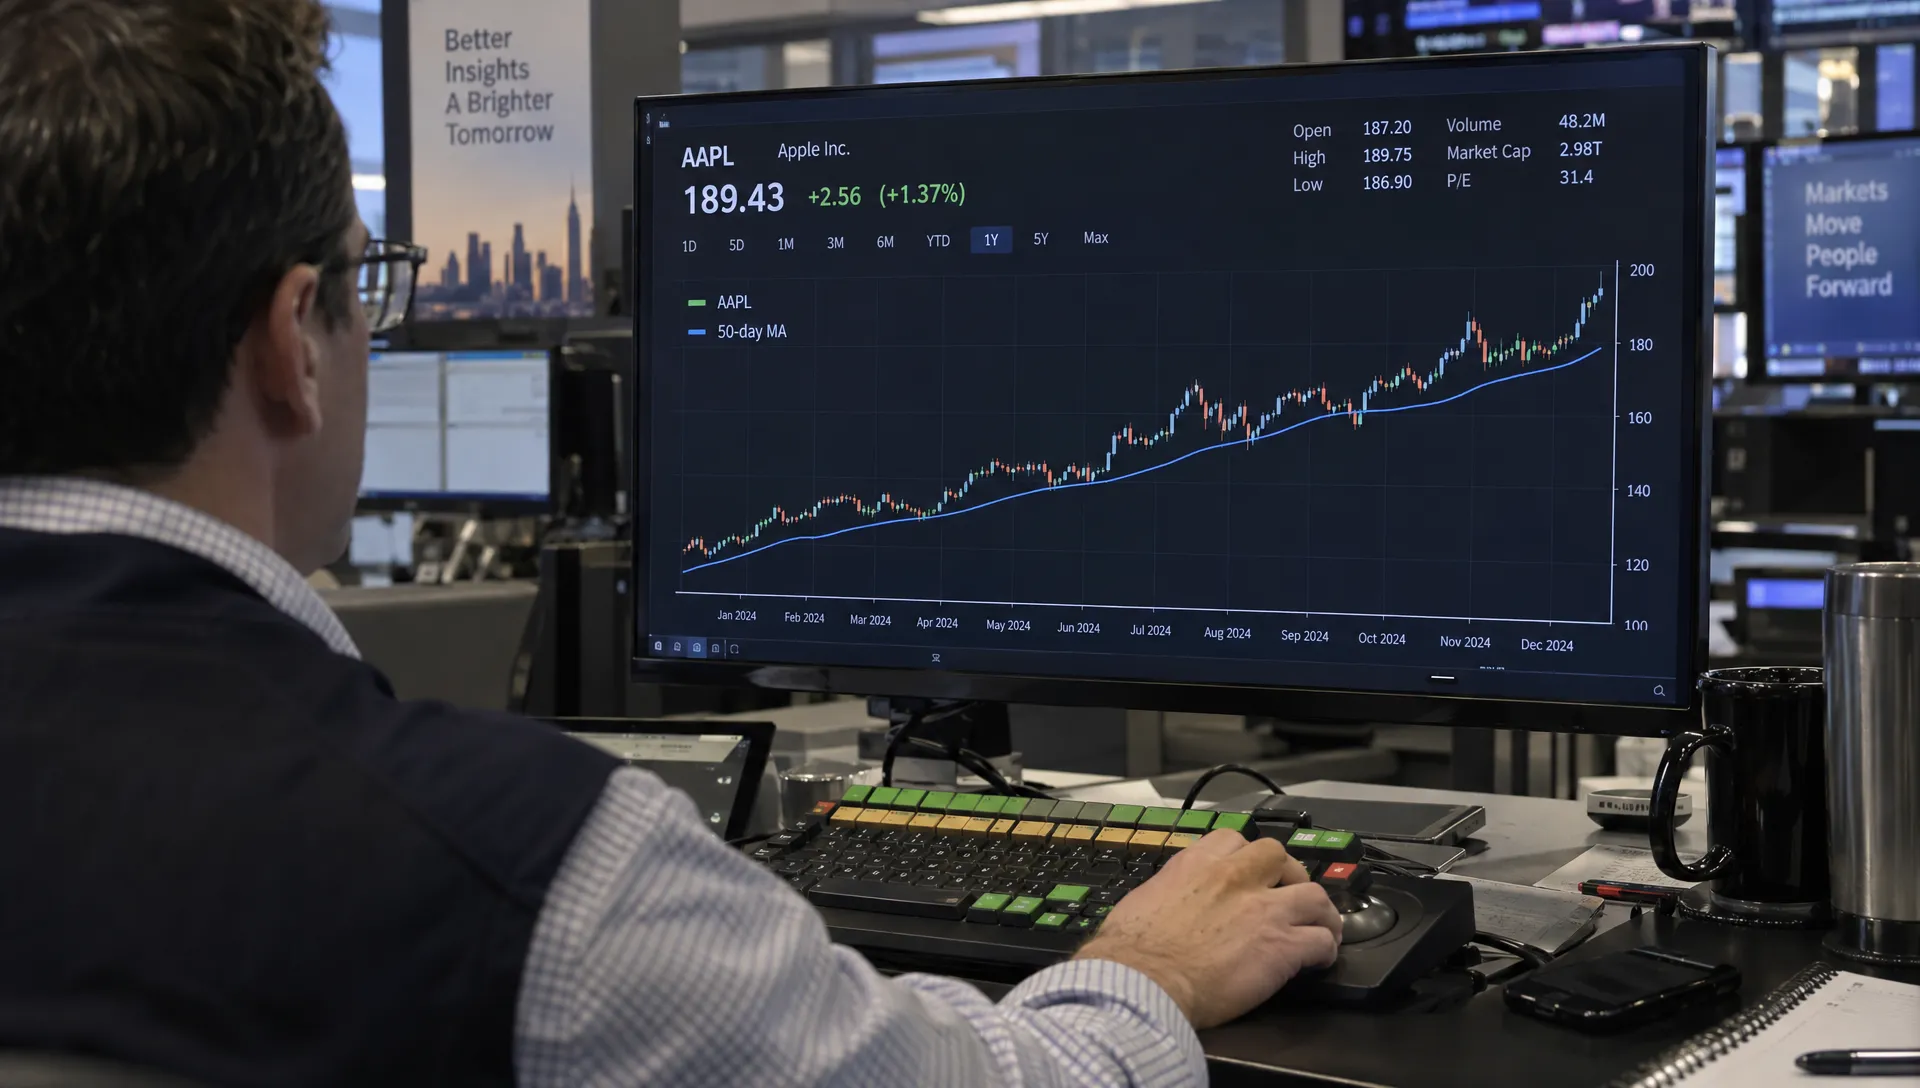
For a retail investor evaluating an intermediate-term trend, a rising 50-day simple moving average is a useful starting point. It summarizes price direction clearly, but it is not a proven universal winner or a reliable forecast of tomorrow’s return.
The more useful question is whether an indicator improves a specific decision after accounting for false signals, trading costs and risk. That distinction prevents a common mistake: treating an accurate description of the past as a prediction of the future.
A practical starting point: the 50-day moving average
A simple moving average, or SMA, is the average closing price over a specified number of trading sessions. Each session receives equal weight. Fidelity’s explanation of the simple moving average describes its calculation and use in identifying trends.
If you need a straightforward baseline, the best indicator for stock direction is often less complicated than the chart suggests: begin with price relative to a moving average and the slope of that average.
For an intermediate-term assessment, interpret the relationship this way:
- Price above a rising 50-day SMA: Evidence of an established upward trend, not a guarantee of further gains.
- Price below a falling 50-day SMA: Evidence of an established downward trend, not proof that another decline is imminent.
- Price repeatedly crossing a flat SMA: A weak directional reading that may reflect a sideways market.
The trade-off is unavoidable. A shorter average reacts faster but changes direction more frequently. A longer average smooths more noise but recognizes reversals later. Neither eliminates uncertainty, and neither tells you whether a stock is attractively valued.
Choosing the best indicator for stock direction by time horizon
Choose the decision window before choosing the indicator. Otherwise, you can find an apparently bullish signal on one chart and a bearish signal on another without knowing which matters.
| Decision horizon | Useful starting point | What it helps assess | Main limitation |
|---|---|---|---|
| Intraday | Price relative to session VWAP | Trading above or below the session’s volume-weighted average price | Resets each session and does not establish a longer-term outlook |
| Several weeks to months | Price relative to a rising or falling 50-day SMA | Intermediate trend direction | Can lag reversals and generate repeated signals in sideways markets |
| Several months or longer | 200-day SMA with business analysis | Broad price trend alongside company prospects | Can react slowly and cannot measure intrinsic value |
| Multi-year investing | Earnings, cash flow, valuation and competitive position | Whether business performance can support the investment thesis | Sound businesses can still deliver disappointing returns at excessive prices |
For a multi-year investor, the best indicator for stock direction cannot be selected independently of valuation and future business performance. A strong chart does not establish that expected returns justify the price.
You can use daily charts to monitor a longer-term holding, but keep the role explicit. A short-term price signal should not quietly replace the investment thesis you used to buy it.
Compare indicators by the question they answer
Adding indicators does not necessarily add independent evidence. Moving averages, MACD and RSI all draw information from prices, so agreement among them can partly reflect repeated processing of the same inputs.
MACD compares faster and slower exponential moving averages. It can help describe changing momentum, but it is not a separate source of information about earnings or valuation.
RSI measures the balance of recent upward and downward price changes. An elevated reading can accompany a strong uptrend. Treating “overbought” as an automatic sell signal can put you against a persistent move.
ADX measures trend strength rather than direction. A high reading can accompany either a strong advance or a strong decline. It needs directional context.
Relative strength against a benchmark asks whether a stock is outperforming a relevant index or sector. This is different from RSI. A stock can rise while still trailing its benchmark.
When assessing the best indicator for stock direction, prioritize complementary questions rather than the number of indicators agreeing. Use price structure for direction, benchmark-relative performance for leadership and volume for participation context.
For more detail on those individual tools, Upside’s guide to technical trend indicators traders actually use explains their roles and limitations.
A worked example: bullish does not mean buy immediately
Consider a hypothetical stock trading at $104. Its 50-day SMA is $100, up from $98 two weeks earlier. The stock has also outperformed its sector benchmark over the period you are evaluating.
Those observations support an upward-trend classification. They do not establish the probability of a gain tomorrow or tell you whether buying at $104 offers an acceptable trade-off between potential return and loss.
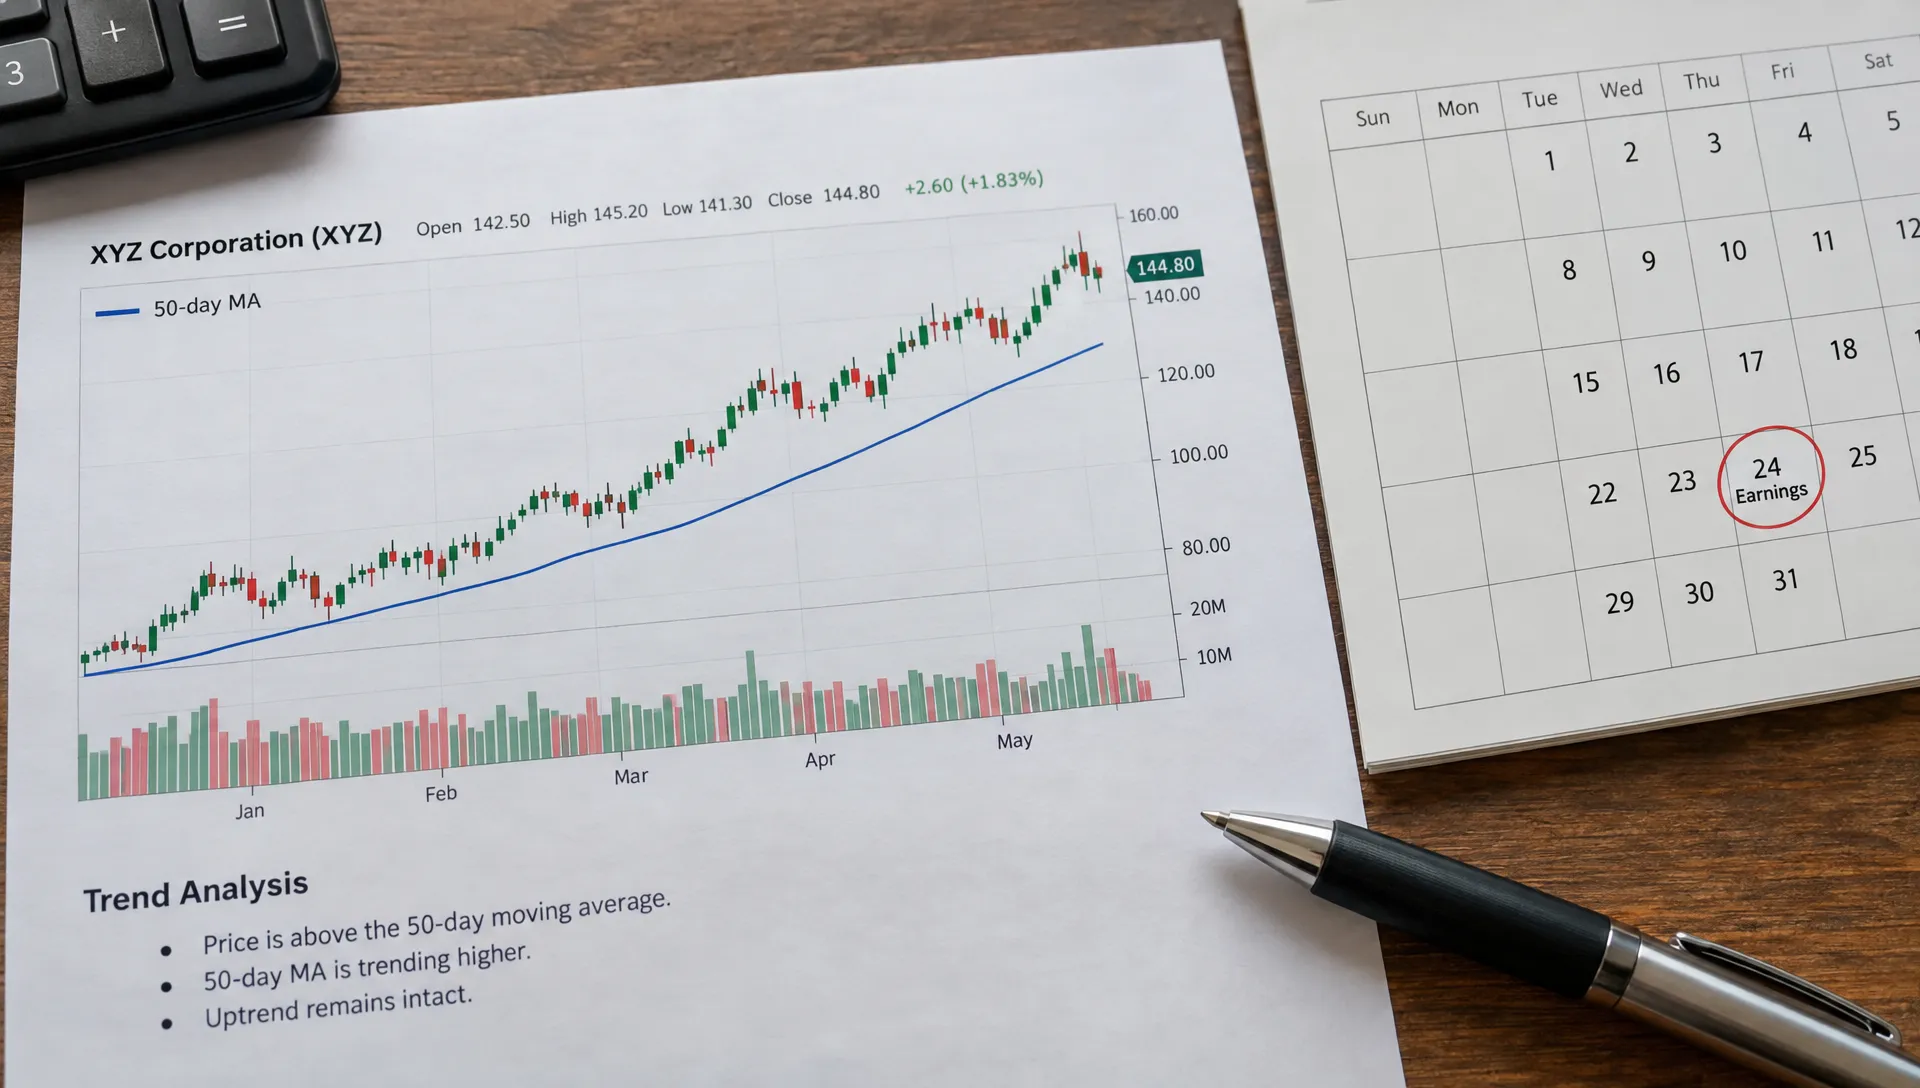
Now add two facts: the company reports earnings tomorrow and the stock recently accelerated sharply away from its average. Your trend reading has not changed, but the decision has. An earnings surprise could cause an overnight gap, and a pullback could occur without ending the broader trend.
Before acting, define the decision you are making. An investor adding to a long-term position needs to revisit valuation and portfolio concentration. A short-term trader needs an entry rule, an invalidation condition and a position size consistent with the loss they can tolerate.
Even the best indicator for stock direction cannot replace those decisions. If the stock gaps from $104 to $92, a planned exit around $98 may not execute at that price. A bullish reading never removes execution risk.
The example is illustrative, not a recommendation. Its purpose is to separate three things that charts often blur together: identifying direction, choosing an entry and controlling exposure.
How to test whether an indicator is useful
A useful indicator should improve a defined decision under conditions that resemble how you would actually use it. A chart with several successful historical signals is not enough.
Define the rule before inspecting results
Specify the indicator, timeframe, signal and outcome you want to measure. For example: “When the daily close moves above a rising 50-day SMA, measure the stock’s return over the next 20 trading sessions.”
That is a testable rule, not a complete trading strategy. You still need to decide how to handle repeated signals, overlapping positions, exits and available capital.
To evaluate the best indicator for stock direction, compare it with a simple baseline. Does the rule improve on holding the stock throughout the same period? Does it reduce losses at the cost of missing recoveries? Does it mainly work because the market was already rising?
Separate development from evaluation
Develop the rule on one historical period, then evaluate it on a later period you did not use to select the settings. A walk-forward process repeats that sequence through time.
Use only information that would have been available at each decision point. A signal calculated from today’s closing price should not assume execution at that same closing price unless your execution method could realistically achieve it.
If you test many settings and report only the winner, the apparent advantage may be a product of selection rather than a durable relationship. Include different market environments and account for companies that disappeared from the dataset when testing a stock universe.
Measure more than directional accuracy
A high percentage of correct calls can coexist with poor returns if the losing trades are much larger than the winners. Evaluate average gains and losses, drawdowns, turnover and time out of the market.
Include realistic spreads, slippage and fees where applicable. Taxes may also affect your personal outcome. An indicator that looks useful before costs can become impractical when it generates frequent trades.
What verified investor holdings can add
Portfolio data answers a different question from a price indicator: what are participating investors actually holding, buying or reducing?
Upside Invest offers verified investor holdings, portfolio comparison tools, trend tracking and return and Sharpe metrics through private anonymous profiles. That information can add context when you are investigating a stock or comparing your exposure with other portfolios.
But the best indicator for stock direction does not become a certainty because successful investors own the same stock. They may have different purchase prices, time horizons, hedges or risk tolerances. Their portfolios may also differ substantially from yours.
Holdings data has another boundary: it describes the investors represented on the platform, not the entire market. Verification supports the authenticity of the portfolio information, not the profitability of copying a position.
Use ownership patterns to generate research questions. Upside’s guide to stock market insights that matter more than daily noise explores how portfolio behavior can complement fundamentals and risk analysis.
Keep emotional pressure separate from signal quality
Repeatedly checking indicators until one supports the trade you want is not confirmation. It is a process problem. Writing down your rule beforehand and scheduling reviews can reduce impulsive changes without requiring another chart tool.
Persistent anxiety, disrupted sleep or difficulty functioning calls for a different response than optimizing an indicator. Consider stepping back from active trading and seeking qualified mental health support. For readers in New York, psychiatric and psychological care at Dr. Iospa Psychiatry Consulting is one option for professional evaluation and support. Mental health care and investment analysis serve different needs.
Frequently asked questions
What is the best indicator for stock direction for beginners? A 50-day SMA is a useful starting point for understanding intermediate trends because its calculation and interpretation are straightforward. It describes recent price behavior rather than guaranteeing future direction.
Is RSI or MACD better for predicting an increase? Neither is universally better. RSI describes recent price-change strength, while MACD describes the relationship between faster and slower averages. Their usefulness depends on the timeframe, market conditions and decision rule.
Can volume confirm that a stock will rise? No. Volume measures trading activity, not a guaranteed future outcome. Elevated volume during an advance can add context, but activity can also increase around reversals or disappointing news.
What should I do when indicators disagree? First check whether they measure different things or use different timeframes. Keep your predetermined decision rule rather than switching to whichever signal supports your preferred outcome. Waiting is a valid choice when the evidence is unclear.
Add portfolio context before acting
Start with one clear directional rule, test its limitations and decide how much risk the resulting decision would introduce. Then use Upside Invest to compare verified holdings and portfolio exposure. Treat those comparisons as research context, not an instruction to copy another investor or a promise about the next price move.