Which Is the Best Indicator of Stock Market Direction? 5 Options
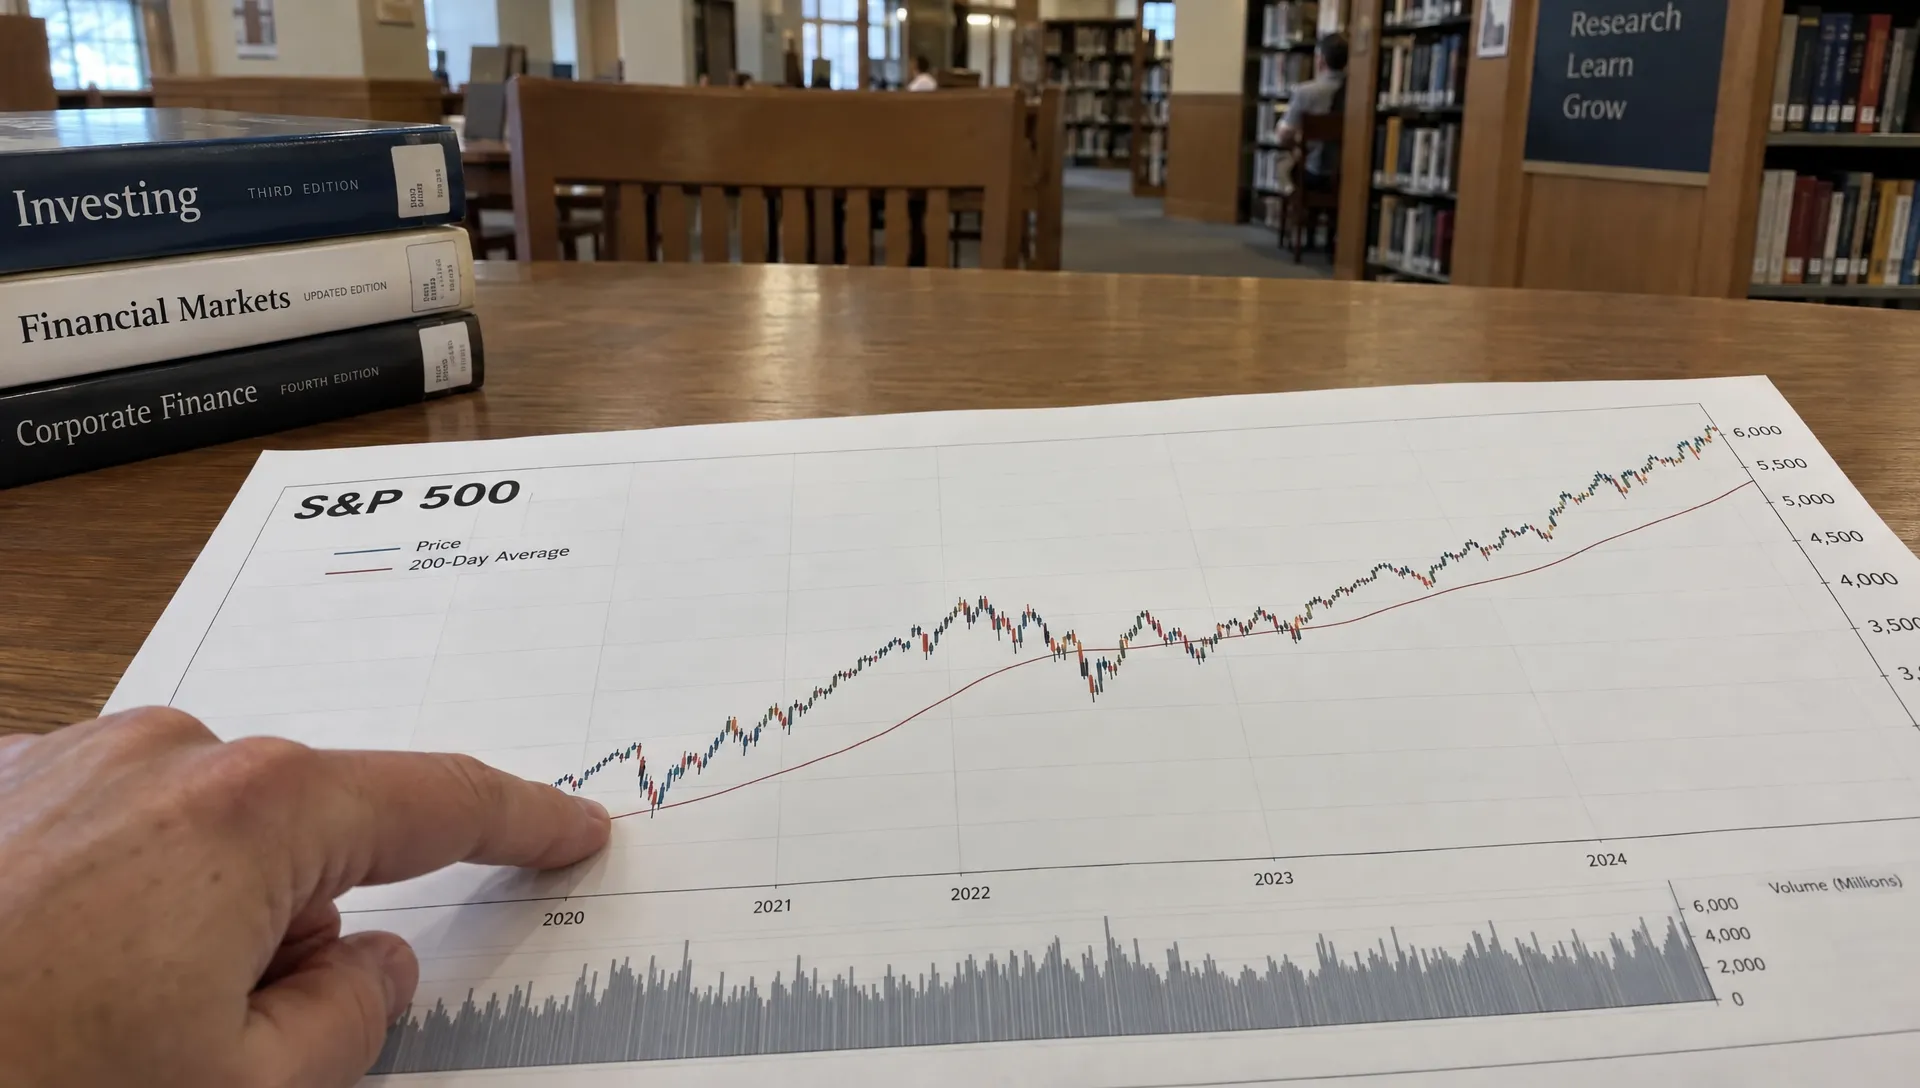
The best indicator of stock market direction depends on whether you want to identify the current trend, test a rally’s strength or watch for economic trouble months ahead. No single measure does all three reliably.
For retail investors following U.S. stocks over months rather than minutes, a broad index’s 200-day moving average is a practical starting point. Add market breadth to check participation and credit spreads to assess financial stress. The yield curve and VIX provide different context, but neither should be treated as a buy-or-sell command.
These five options answer different questions. Understanding those differences is more useful than searching for a signal that never fails.
Five indicators at a glance
| Indicator | Most useful question | Relevant horizon | Main limitation |
|---|---|---|---|
| 200-day moving average | Is the established price trend up or down? | Months | Reacts after prices move |
| Market breadth | Are many stocks supporting the index? | Weeks to months | Divergences can persist |
| High-yield credit spreads | Is financial stress increasing? | Weeks to months | Not a direct equity timing signal |
| Treasury yield curve | Is the economic backdrop becoming more vulnerable? | Quarters | Poor precision for entry and exit dates |
| Cboe VIX | How much near-term volatility is priced into options? | Approximately 30 days | Measures expected volatility, not direction |
Choose an index before interpreting any of them. The S&P 500, Nasdaq Composite and a broad small-cap index can move differently because their constituents and sector exposures differ.
1. Is the 200-day moving average the best indicator of stock market direction?
For identifying an established intermediate-to-long-term trend, it is a useful baseline. A 200-day simple moving average is the average of an index’s closing levels over the most recent 200 trading sessions.
An index above a rising average suggests a different trend environment from one below a falling average. The slope matters because price can briefly cross an otherwise flat line without establishing a durable move.
Its main advantage is transparency: the calculation is straightforward and does not depend on interpreting economic forecasts. Its weakness is equally clear. A moving average confirms what prices have already done; it does not predict the next move.
During sideways markets, repeated crossings can produce whipsaws, meaning reversals that undermine a trend-following rule. Waiting for additional confirmation may reduce some false signals, but it also delays decisions.
Use consistent data when evaluating a rule. A price index excludes dividends, while a total-return index includes their reinvestment. Mixing series can distort comparisons.
This is a market-level filter, not a complete stock-selection method. For individual positions, the relevant tools and time horizons differ, as explained in Upside’s guide to indicators for individual stock direction.
2. Market breadth: best for testing participation
For judging whether an index rally has broad support, market breadth may be the best indicator of stock market direction among these five. It measures how widely a move is shared rather than focusing only on the index level.
Two useful measures are the advance-decline line and the percentage of stocks above their 200-day moving averages.
The advance-decline line accumulates the daily difference between advancing and declining stocks. If an index reaches new highs while its corresponding breadth measure weakens, fewer stocks may be contributing to the advance.
The percentage above the 200-day average offers another view. Improving participation suggests more constituents are establishing longer-term uptrends, even if the headline index has not yet broken out.
Breadth is particularly helpful when a capitalization-weighted index rises because a few large companies are doing most of the work. Narrow leadership is a vulnerability, but it is not proof that a reversal is imminent.
Match the breadth universe to the index you are analyzing. An exchange-wide advance-decline line can include securities outside your chosen benchmark. Comparing mismatched universes may create an apparent divergence that reflects composition rather than deteriorating participation.
Use breadth to adjust confidence in a price trend, not to assume that every divergence demands an immediate trade.
3. High-yield credit spreads: best for checking financial stress
Credit markets provide information that stock charts alone cannot. A high-yield credit spread measures the additional yield investors demand for holding riskier corporate debt relative to an appropriate Treasury benchmark, with adjustments depending on the series.
For assessing financial stress, high-yield spreads are a candidate for the best indicator of stock market direction, although they are not a standalone forecasting tool.
The ICE BofA US High Yield Index Option-Adjusted Spread published on FRED is one accessible series to monitor. Rising spreads indicate that investors require more compensation for credit risk. Falling spreads indicate less required compensation.
When stocks weaken while spreads widen, the two markets are delivering a more consistent warning than either signal alone. When stocks rally but spreads continue widening, the disagreement deserves investigation.
Avoid treating a single spread level as a universal trigger. Credit conditions, industry composition and the starting economic environment all affect interpretation. Sustained changes can be more informative than one daily observation.
There are also timing limits. Credit stress can develop alongside falling equities rather than before them. Some equity selloffs reflect valuation changes without a comparable deterioration in corporate credit. Spreads add a distinct risk perspective, not an advance warning for every correction.
4. The Treasury yield curve: best for economic context
The yield curve compares Treasury yields across maturities. One widely followed measure subtracts the three-month Treasury yield from the 10-year Treasury yield. A negative result means this part of the curve is inverted.
An inversion reflects a particular relationship between short- and long-term interest rates. It can accompany restrictive monetary conditions and expectations of weaker growth or lower future policy rates.
If your concern is the economic backdrop over coming quarters, the yield curve belongs in the discussion of the best indicator of stock market direction. It is much less useful for deciding what stocks will do next week.
The Federal Reserve Bank of New York’s yield-curve research and recession probability model explains the connection between the term spread and recession risk. That framework concerns economic probabilities, not a guaranteed stock-market path.
Stocks can rise during an inversion. They can also decline before an economic contraction becomes obvious. A curve that steepens again is not automatically an all-clear signal, especially when short-term yields fall because growth expectations are weakening.
Use the curve to stress-test assumptions about earnings, financing costs and portfolio concentration. Keep the distinction clear: an economic warning and an actionable market-timing rule are not the same thing.
5. Cboe VIX: best for understanding expected volatility
The VIX is derived from S&P 500 index option prices and represents market-implied expectations of approximately 30-day volatility. The Cboe explanation of the VIX Index describes what the measure captures.
It is often called a fear gauge, but that nickname can mislead. Volatility describes the size of fluctuations, not their direction. A high reading does not guarantee falling stocks, just as a low reading does not guarantee a stable advance.
For that reason, VIX alone is not the best indicator of stock market direction. Its better role is to show whether options markets are pricing a relatively calm or turbulent environment.
Look at the context of a change. Rising VIX alongside falling prices and deteriorating breadth suggests a different risk environment from a brief volatility increase during an otherwise intact uptrend.
Avoid interpreting an elevated reading as an automatic buying opportunity. Volatility can remain high while stocks continue falling. Equally, subdued volatility can persist while an advance continues.
VIX is also specific to S&P 500 options. It does not directly describe the risk of a concentrated small-cap portfolio, an international equity allocation or a crypto position. Your holdings may behave very differently from the market underlying the index.
How to combine the five without counting the same evidence twice
Start with three separate questions: what are prices doing, how broad is participation and are financing conditions becoming more stressed?
The best indicator of stock market direction becomes more useful when other evidence tests its message rather than merely repeats it. Adding several price-based oscillators can create the appearance of confirmation without adding much independent information.
The following scenarios are illustrative, not a description of current conditions:
| Hypothetical combination | Reasonable interpretation | Unjustified conclusion |
|---|---|---|
| Index above a rising 200-day average, improving breadth and stable credit spreads | Several measures support the uptrend | A correction cannot happen |
| Index rising, weakening breadth and widening spreads | Confidence in the advance should be lower | An immediate crash is certain |
| Index below a falling average, improving breadth and narrowing spreads | Conditions may be improving before the long-term trend turns | A durable recovery is confirmed |
| Inverted yield curve with strong price and breadth trends | Economic caution coexists with market strength | The curve must dictate an immediate exit |
Agreement increases confidence, not certainty. Disagreement is a reason to investigate the exposure and timeframe involved. It does not require forcing every observation into a bullish or bearish label.
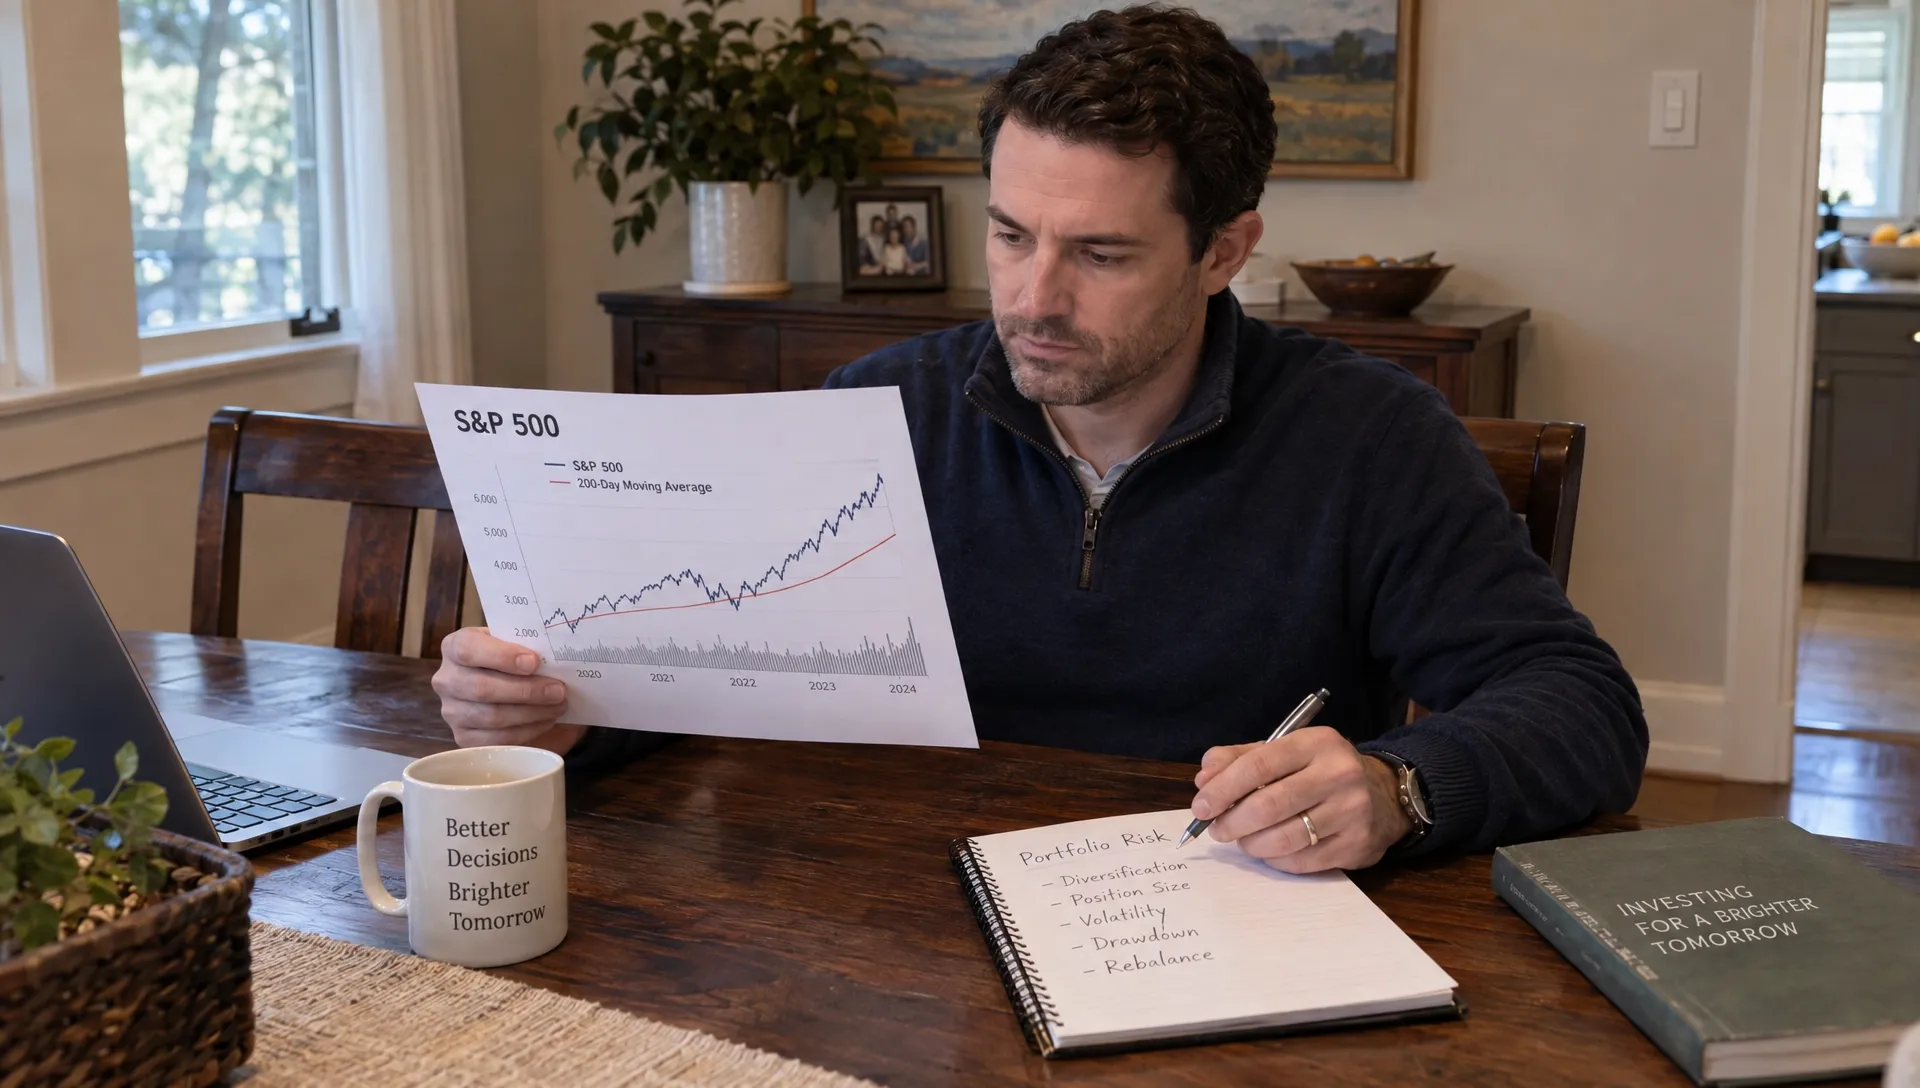
Turn the signals into a repeatable review process
Define your rules before the market moves
Specify the benchmark, observation frequency and purpose of each measure. Someone investing for retirement should not automatically adopt a review schedule designed for short-term trading.
Write down what would change your assessment. For example, an investor might investigate risk more closely when a weakening price trend coincides with deteriorating breadth and widening credit spreads. That is a review framework, not a universally optimal trading rule.
Even the best indicator of stock market direction cannot compensate for an undefined decision process. Decide whether a signal prompts research, a rebalancing review or a predetermined exposure change before reacting to it.
Evaluate the portfolio result, including friction
Any historical test should use information available at the time, realistic execution assumptions and an appropriate benchmark. Check returns, drawdowns, turnover and the consequences of remaining out of the market during recoveries.
Include transaction costs and slippage. In taxable accounts, realized gains can also affect after-tax results. An attractive gross return does not necessarily translate into a better outcome after implementation.
Keep trade confirmations, cost-basis records and tax documents organized. Investors who need assistance preparing U.S. filings can explore Archie Contable’s tax preparation services, separately from decisions about which investments to buy or sell.
Portfolio construction still matters. A broad-market indicator cannot tell you whether your own holdings are excessively concentrated in one company or sector. Review the exposure you actually own, not just the benchmark you watch.
Frequently asked questions
Can any indicator reliably predict a market crash? No indicator guarantees a timely crash warning. The best indicator of stock market direction for identifying an existing trend can still react too late to a sudden shock. Diversification, position sizing and liquidity planning address risks that forecasting cannot eliminate.
Is RSI or CCI better for tracking the overall market? Neither is universally better. Both are price-based oscillators, so their usefulness depends on the market regime, settings and timeframe. They can describe momentum in an index, but they do not replace breadth or credit information. Upside’s guide to momentum indicators and their distinct roles covers that narrower question.
What are the “big three” market indicators? There is no universally accepted set. For a simple market review, price trend, breadth and credit conditions offer three distinct perspectives. The yield curve adds economic context, while VIX adds information about expected near-term volatility.
Should long-term investors sell when an index falls below its 200-day average? Not automatically. That depends on whether a tested trend rule is part of their investment policy, along with their taxes, cash needs and risk tolerance. A line crossing alone is not a complete investment plan.
Compare the market signal with your actual holdings
Use the best indicator of stock market direction as a starting point, not a reason to copy someone else’s trades. Market conditions and portfolio suitability are different questions.
Upside Invest lets investors compare allocations and explore verified holdings through private, anonymous profiles. Use that context to investigate concentration, sector exposure and differences from other portfolios, while keeping your own objectives and risk limits central.