Portfolio Performance Comparison Beyond One-Year Returns
A one-year return is easy to understand. It is also easy to misuse.
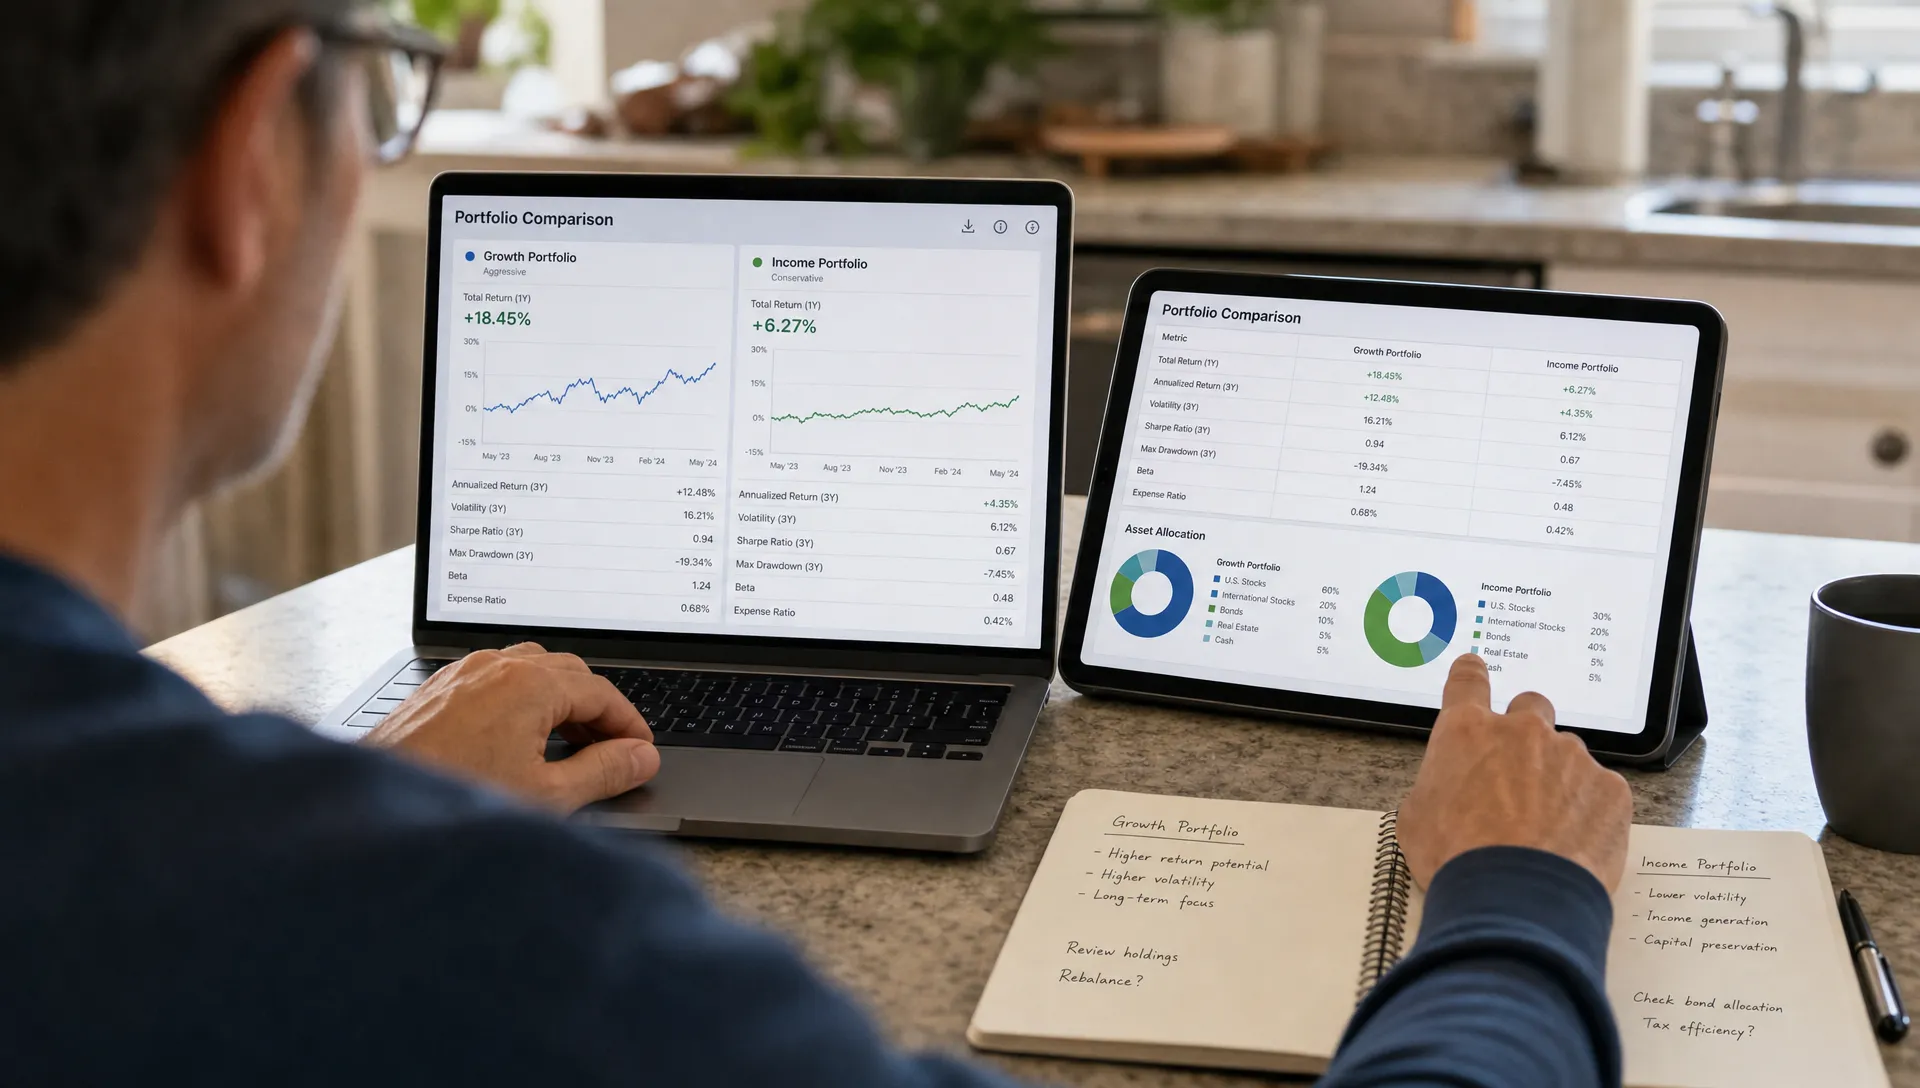
If your portfolio gained 18% over the last 12 months and another investor gained 11%, the first portfolio looks better at a glance. But that snapshot may hide a very different story: one portfolio may have taken twice the risk, recovered from a deep drawdown or benefited from a concentrated bet that is unlikely to repeat. The other may have been steadier, better diversified and more aligned with the investor’s goals.
That is why a useful portfolio performance comparison should go beyond the last calendar year. The real question is not only “Who made more?” It is “Who earned returns in a way that is repeatable, risk-aware and relevant to my own situation?”
Why one-year returns can mislead
A 12-month return is heavily influenced by timing. If the period begins just after a market bottom, aggressive portfolios often look brilliant. If it begins near a peak, defensive portfolios can look superior. Neither result necessarily tells you much about long-term decision quality.
One-year performance also compresses many different investing behaviors into one number. A portfolio that was lucky with a single AI stock, crypto token or rate-sensitive bond fund can rank above a more disciplined portfolio for a short period. That does not mean it has a better process.
The issue gets worse when investors compare portfolios with different goals. A retired investor seeking income, a 28-year-old growth investor and a trader holding speculative assets should not be judged by the same one-year yardstick. Their expected volatility, liquidity needs and time horizons are different.
In 2026, this matters even more because many portfolios blend stocks, ETFs, cash, private funds and crypto. A single return number struggles to explain what is actually driving outcomes across those asset classes.
Start with the right return calculation
Before comparing performance, make sure you are comparing the same type of return. Two common methods answer different questions.
| Return type | What it measures | Best used for | Main limitation |
|---|---|---|---|
| Time-weighted return | How the investment strategy performed without the impact of deposits and withdrawals | Comparing managers, model portfolios and strategies | Less personal to your actual cash flow experience |
| Money-weighted return | How your invested dollars performed based on when you added or removed money | Evaluating your personal investor experience | Can reward or punish timing decisions more than portfolio selection |
| Simple account return | Ending value versus starting value, often adjusted loosely for cash flows | Quick personal checks | Can be misleading if contributions or withdrawals were large |
For a fair portfolio performance comparison, do not compare your money-weighted return to someone else’s time-weighted return and assume the higher number means better investing. If you added a large amount right before a rally, your money-weighted return may look better than the portfolio’s underlying strategy. If you added right before a downturn, the opposite can happen.
The cleaner approach is to use time-weighted returns when comparing strategies and money-weighted returns when evaluating your own behavior and cash flow timing.
Use multiple time horizons, not just one
A better comparison looks across several windows. One year still has a place, but it should sit beside shorter and longer periods.
A practical dashboard might include year to date, one-year, three-year and five-year returns. For newer portfolios, use all available history and label it clearly. For older portfolios, rolling periods often reveal more than fixed calendar windows.
Rolling returns ask a better question: how often did this portfolio deliver strong outcomes across many possible start dates? A fund or investor may have an excellent five-year return because of one extraordinary stretch. Rolling analysis can show whether returns were consistent or dependent on one unusually favorable period.
Calendar-year returns are also useful because they show how a portfolio behaved in different environments. A portfolio that performs well only during liquidity-driven bull markets may not deserve the same confidence as one that holds up across rate hikes, inflation shocks and market rotations.
Look at the risk taken to earn the return
Return without risk context is incomplete. A portfolio that gained 14% with mild volatility is not the same as one that gained 14% after dropping 35% along the way.
Risk metrics are imperfect, but they help investors ask better questions. Instead of treating volatility as a purely academic concept, translate it into lived experience. Could you hold through the drawdown? Would you rebalance or panic sell? Would your financial plan still work?
| Metric | What it helps reveal | What to watch for |
|---|---|---|
| Volatility | How widely returns fluctuate | High volatility may be acceptable for long-term investors, but only if expected |
| Maximum drawdown | The largest peak-to-trough loss | Deep drawdowns can trigger bad timing decisions |
| Sharpe ratio | Return earned per unit of total volatility | Can understate risks that are not captured by standard deviation |
| Sortino ratio | Return earned relative to downside volatility | Useful when investors care more about losses than upside swings |
| Beta | Sensitivity to a market benchmark | A high beta portfolio may look skilled during bull markets |
| Correlation | How closely assets move together | Low correlation can disappear during market stress |
A strong portfolio performance comparison asks whether higher returns came from better decisions or simply more exposure to risk. If one investor outperformed by holding a portfolio with much higher beta, the result may be less impressive than it looks.
Separate skill, strategy and luck
Short-term outperformance often comes from concentration. That is not automatically bad. Many successful investors run concentrated portfolios. The key is to understand whether the concentration reflects a deliberate strategy or an accidental exposure.
For example, an investor may think they own a diversified portfolio because they hold ten ETFs. But if several of those ETFs are heavily weighted toward the same mega-cap technology stocks, the portfolio may be less diversified than it appears. Another investor may hold individual stocks, but spread exposure across sectors, geographies and business models more effectively.
This is where holdings-level analysis matters. Comparing only returns can hide overlap, factor exposure, sector concentration and currency risk. If you want to go deeper on the risk side of comparison, Upside Invest has a separate guide on portfolio comparison tips that reveal hidden risk.
Benchmarks also need care. A 90% equity portfolio should not be judged against a conservative 40% equity benchmark. A global portfolio should not be judged only against the S&P 500 unless that is truly the investor’s opportunity set. For more detail on avoiding benchmark mistakes, see this guide on how to compare portfolio performance to a benchmark without bias.
Compare against relevant peers, not just market indexes
Indexes are useful, but they are not the only comparison point. Retail investors often want to know how their allocation compares with people who have similar goals, risk tolerance or market views.
Peer comparison can add context that benchmarks miss. If growth investors with similar risk levels are increasing healthcare exposure while your portfolio is almost entirely concentrated in semiconductors, that does not mean you are wrong. It does mean you should know the difference.
At this stage, portfolio performance comparison becomes less about copying other investors and more about identifying blind spots. The value comes from seeing what verified investors are buying, holding and outperforming with, then deciding whether any of that information is relevant to your own plan.
Watch the path of returns
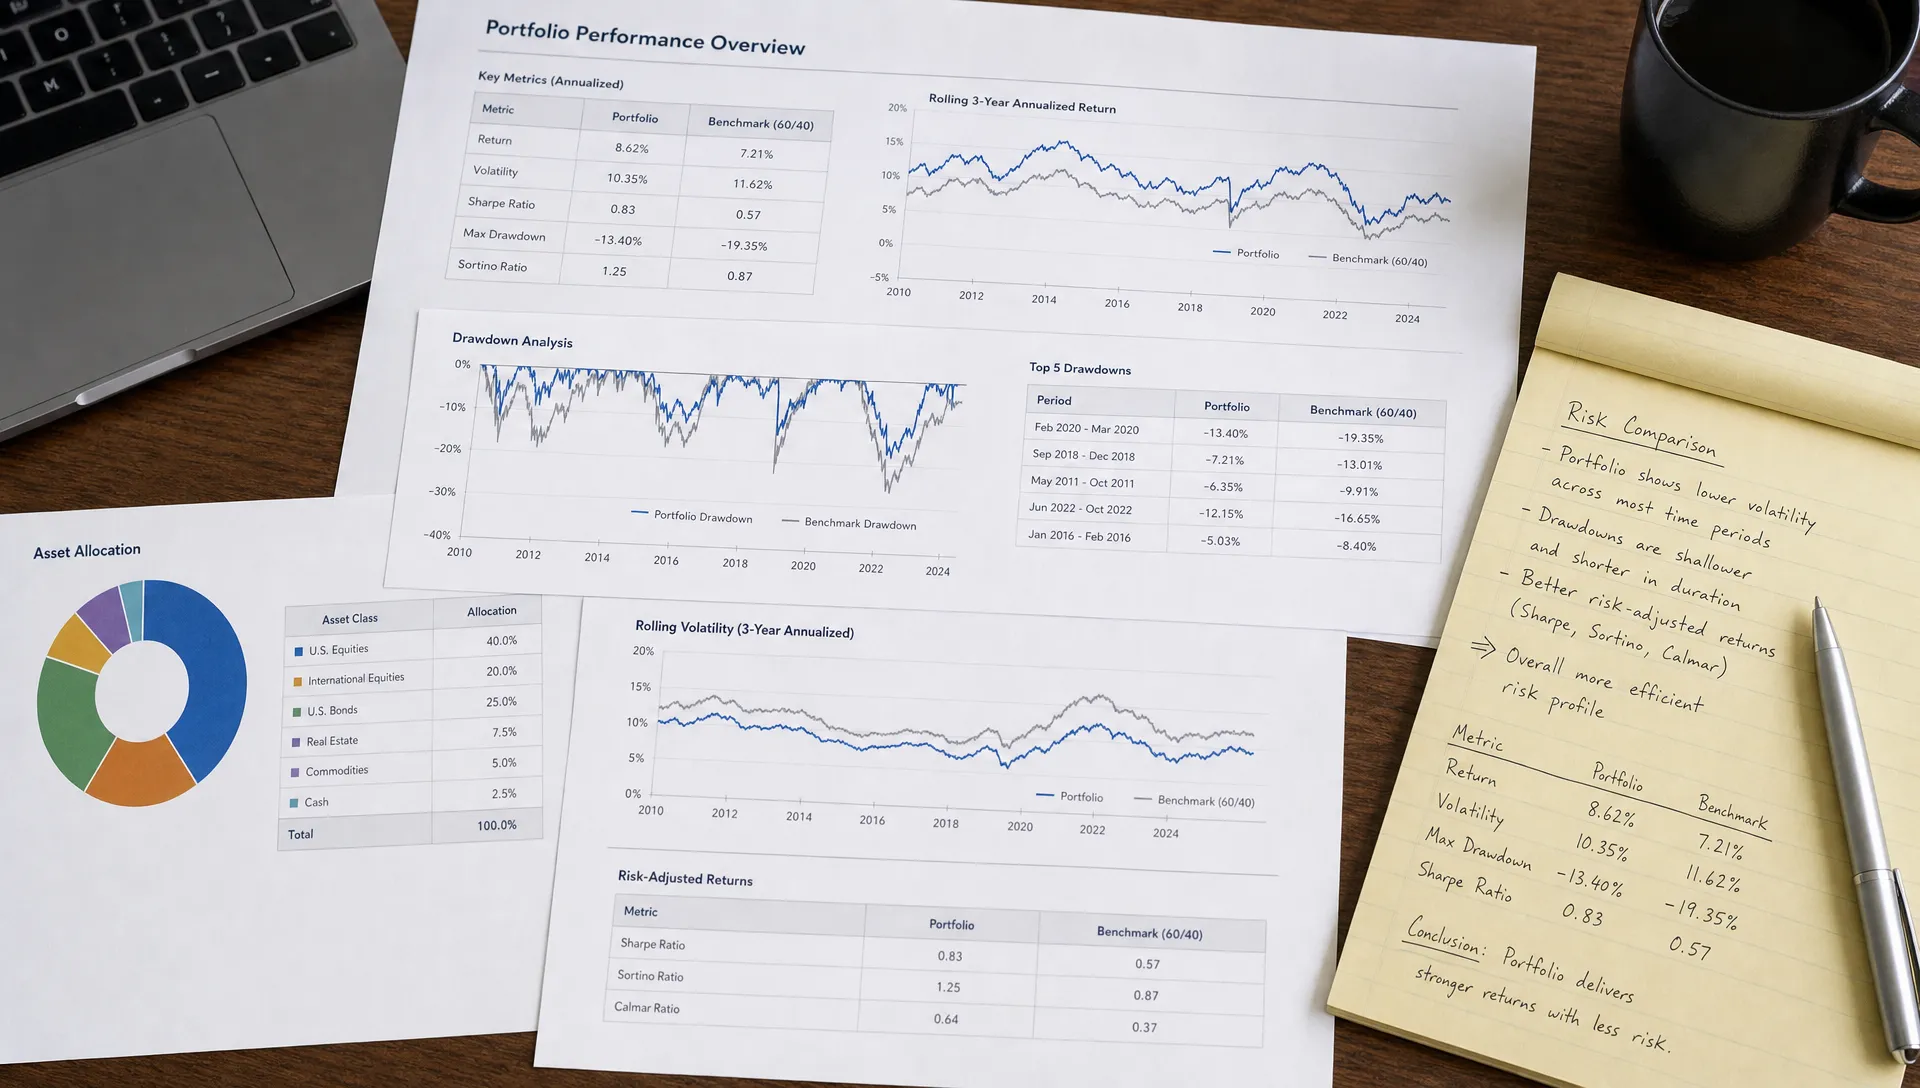
Two portfolios can end in the same place and feel completely different along the way. The path matters because investors do not experience returns as a final spreadsheet total. They experience the monthly account balance, the bad quarter, the temptation to sell and the regret after a rebound.
Consider two portfolios that both return 10% over one year.
| Portfolio | One-year return | Worst drawdown | Monthly pattern | Investor experience |
|---|---|---|---|---|
| Portfolio A | 10% | 8% | Moderate gains with a few small declines | Easier to hold through volatility |
| Portfolio B | 10% | 32% | Large early loss followed by a sharp recovery | Harder to hold without abandoning the plan |
Portfolio B is not automatically worse. Some strategies accept large drawdowns in pursuit of higher long-term returns. But if both ended with the same one-year result, Portfolio A delivered a smoother ride. For many investors, that matters because behavior affects realized returns.
This is why maximum drawdown, recovery time and downside capture deserve a place beside annual return. A portfolio that recovers quickly from losses may be more resilient than one that spends years below its previous high.
Adjust for contributions, withdrawals and rebalancing
Retail investors rarely invest one lump sum and leave it untouched. They add money from paychecks, withdraw for expenses, rebalance taxable accounts and sometimes shift allocations after big market moves.
Those choices can distort comparison. If you added capital to equities during a market low, your personal return may beat a similar portfolio whose owner added at the top. That may reflect good discipline, good luck or a systematic contribution plan. The return alone cannot tell you which.
Rebalancing also changes the story. A portfolio that sells winners and buys laggards may trail during a momentum-driven rally but reduce risk when leadership rotates. A portfolio that never rebalances may outperform in the short run because its winning positions grow larger and larger. That can be rewarding until concentration becomes a problem.
When comparing portfolios, review both the outcome and the process behind it:
- How often was the portfolio rebalanced?
- Were cash flows systematic or reactive?
- Did the investor change strategy after losses?
- Did taxes or transaction costs reduce the realized result?
- Was the portfolio built for growth, income, capital preservation or speculation?
These questions turn performance comparison from a ranking exercise into a decision-making tool.
Include taxes and costs when they affect reality
A pre-tax return can flatter an active strategy. If frequent trading generates short-term gains in a taxable account, the after-tax result may look very different. Fund expense ratios, bid-ask spreads and advisory fees can also erode performance over time.
Tax treatment varies by account type and jurisdiction, so investors should avoid broad assumptions. The key principle is simple: compare returns in the form that matters for the decision. If you are choosing between two taxable strategies, after-tax performance may matter more than headline return. If you are comparing retirement accounts, pre-tax or tax-deferred performance may be more relevant.
Costs deserve the same treatment. A higher-fee strategy can be worth it if it delivers better risk-adjusted outcomes after fees. But if two portfolios have similar exposures and similar returns, lower cost usually creates a clearer advantage.
Trust the data before trusting the ranking
Any ranking is only as good as the data behind it. Screenshots, social media posts and manually typed allocations can be useful conversation starters, but they are not the same as verified holdings.
For platforms that handle investor data, trust also includes privacy, permissioning and operational controls. Financial technology companies increasingly rely on automated systems to manage regulated workflows, and tools like AI for compliance teams show how compliance automation is becoming part of the broader infrastructure behind data-driven financial products.
For investors, the takeaway is practical: prefer comparisons based on verified, privacy-aware data over unverified claims. An anonymous verified profile can be more useful than a public boast if the underlying holdings and performance metrics are more reliable.
Build a better comparison framework
A modern portfolio performance comparison should combine outcome, risk, behavior and context. You do not need dozens of metrics. You need a repeatable structure that prevents one number from dominating your judgment.
A strong framework can be simple:
- Match the goal first: Compare growth portfolios with growth portfolios, income portfolios with income portfolios and speculative portfolios with speculative portfolios.
- Use consistent return math: Know whether you are looking at time-weighted, money-weighted, pre-tax or after-tax returns.
- Review multiple windows: Include one-year performance, but add rolling periods and longer horizons when available.
- Add risk metrics: Look at drawdown, volatility, Sharpe ratio and concentration before praising outperformance.
- Inspect holdings: Identify what actually drove returns, including sectors, factors, funds, stocks and crypto exposure.
- Compare with relevant peers: Use indexes for market context and verified investors for behavioral and allocation context.
This framework helps you avoid the most common mistake: treating performance as proof without checking what produced it.
How Upside Invest fits into the process
Upside Invest is built around the idea that investors learn more when they can compare real portfolios with better context. Instead of relying only on index returns or social media claims, Upside focuses on verified investor holdings, anonymous profiles, portfolio comparison tools, trend tracking, return metrics and Sharpe metrics.
That does not mean you should copy another investor’s trades. A peer’s best position may not fit your time horizon, risk level or tax situation. The point is to see what verified investors are doing, understand how their portfolios differ from yours and use that information to ask sharper questions.
If you want to understand this approach in more detail, Upside’s guide on how Upside Invest helps you benchmark your portfolio explains how community benchmarking can complement traditional market indexes.
Frequently Asked Questions
Why is one-year return not enough for portfolio comparison? One-year return is sensitive to start date, market regime and short-term luck. It can hide volatility, drawdowns, concentration risk and whether the portfolio’s process is repeatable.
What is the best metric for portfolio performance comparison? There is no single best metric. A useful comparison combines return, volatility, maximum drawdown, Sharpe ratio, benchmark relevance, holdings analysis and time horizon.
Should I compare my portfolio to the S&P 500? Only if the S&P 500 is a fair benchmark for your strategy. A global, balanced, income-focused or crypto-heavy portfolio usually needs a different benchmark or a blended benchmark.
How often should I compare portfolio performance? Quarterly reviews are often enough for long-term investors. Checking too often can encourage short-term reactions, but reviewing too rarely can allow drift, hidden risk or poor decisions to go unnoticed.
Can peer portfolio comparison improve investing decisions? It can, if the peer data is verified and relevant. Peer comparison is most useful for spotting allocation differences, emerging themes, concentration risks and alternative ways to express an investment view.
A one-year return is a starting point, not a verdict. The better approach is to compare portfolios through time, risk, holdings, behavior and peer context. When you do that, performance becomes more than a scoreboard. It becomes a clearer way to understand whether your portfolio is doing the job you built it to do.