Investment Portfolio Comparison for Different Risk Levels
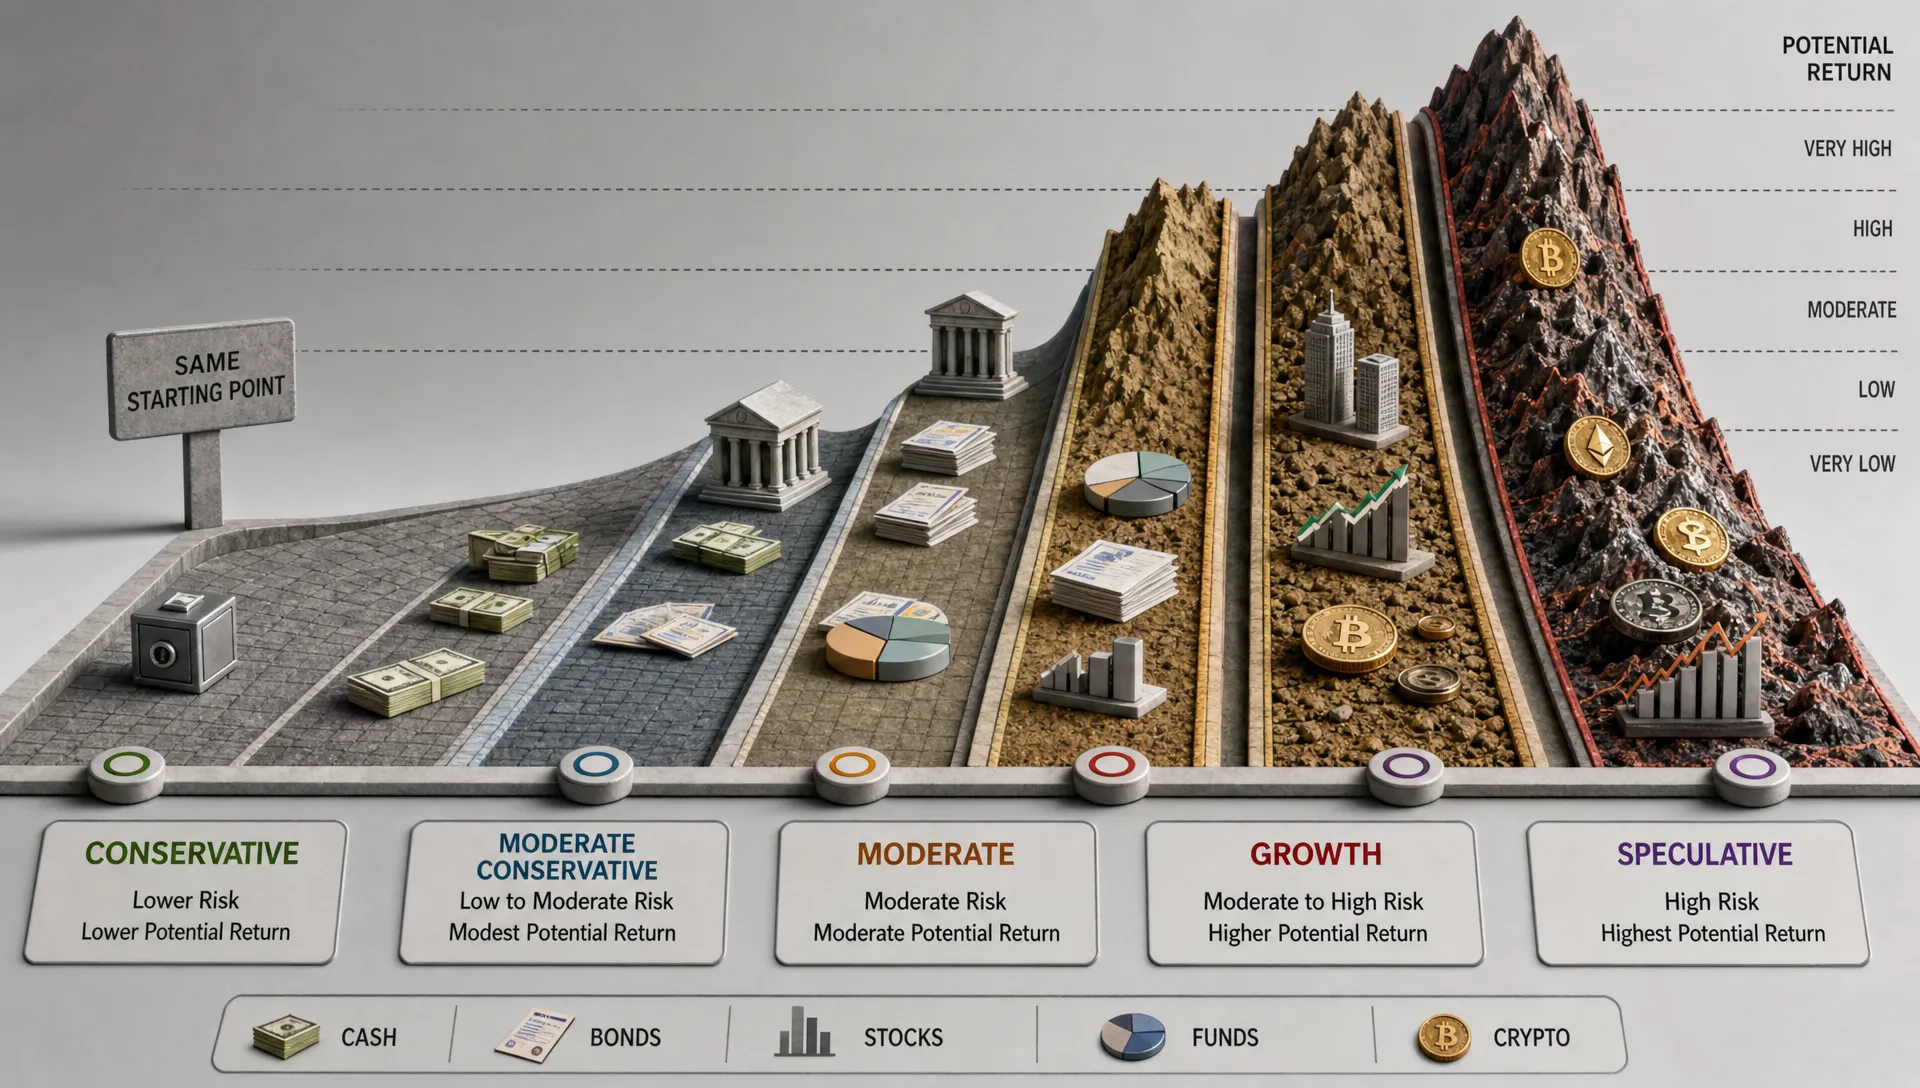
An investment portfolio comparison is only useful when the portfolios belong in the same risk neighborhood. A conservative income portfolio and an aggressive growth portfolio may both be well designed, but they are built to solve different problems. Judging one by the other can lead to overconfidence, unnecessary trading or a risk level that does not match your life.
A better comparison starts with a simple question: what kind of risk was this portfolio designed to take? Once you answer that, returns become easier to interpret. A 7% annual return may be excellent for a low-volatility portfolio built around capital preservation, but underwhelming for a concentrated portfolio that regularly drops 30% during market stress.
This guide breaks down how to compare investment portfolios across conservative, balanced, growth, aggressive and speculative risk levels, with the metrics and context that matter most for each.
Why risk level changes the entire comparison
Risk is not one thing. It includes volatility, drawdowns, concentration, liquidity, inflation exposure, interest rate sensitivity, currency exposure and the chance that an investor sells at the wrong time. Two portfolios can have the same long-term return but create very different experiences along the way.
Imagine two investors who both earn 8% annually over a full market cycle. One portfolio never falls more than 12% from peak to trough. The other falls 45% during a bear market before recovering. On a performance chart, the ending wealth may look similar. In real life, the second investor needed much more emotional and financial capacity to stay invested.
That is why risk level should come before performance ranking. If you compare a low-risk portfolio against high-risk peers, it will often look slow during bull markets. If you compare a high-risk portfolio against defensive peers, it may look brilliant until the next liquidity shock or sector rotation. For a broader framework, Upside Invest has a useful guide on how to compare investment portfolios without focusing only on returns.
Start with risk capacity, tolerance and required risk
Before comparing portfolios, separate three concepts that investors often blend together.
Risk capacity is the amount of financial risk you can afford to take. It depends on time horizon, cash needs, income stability, debt, tax situation and dependents. A 30-year-old with stable income and no near-term withdrawals usually has more risk capacity than someone drawing from a portfolio next year.
Risk tolerance is the amount of volatility you can live with without abandoning the plan. Some investors can watch a portfolio fall 25% and rebalance calmly. Others lose sleep after a 7% pullback. Neither is morally better. The useful portfolio is the one you can hold through bad markets.
Required risk is the level of risk needed to pursue a financial goal. If your goal is already well funded, taking aggressive risk may be optional. If your goal requires growth above inflation, an overly defensive portfolio may carry a different kind of risk: failing to compound enough.
A strong investment portfolio comparison considers all three. The best peer group is not simply people your age or investors with similar account sizes. It is investors with similar goals, time horizons and risk constraints.
Risk levels and what to compare
Risk labels are imperfect, but they help organize the comparison. The point is not to force every portfolio into a rigid category. The point is to avoid comparing portfolios that were built for different jobs.
| Risk level | Primary goal | What usually drives returns | Best comparison group | Main warning sign |
|---|---|---|---|---|
| Conservative | Preserve capital and fund near-term needs | Cash, short-term bonds, high-quality income, low equity exposure | Other capital preservation or income-focused portfolios | Chasing yield without noticing credit or duration risk |
| Balanced | Grow steadily while limiting major drawdowns | Diversified stocks, bonds, cash and sometimes alternatives | Multi-asset portfolios with similar stock and bond exposure | Hidden equity concentration through overlapping funds |
| Growth | Maximize long-term compounding | Equities, sector tilts, factor exposure and global diversification | Long-horizon equity-heavy portfolios | High returns caused by one sector, theme or market regime |
| Aggressive | Seek high upside with high volatility | Concentrated equities, small caps, growth stocks, crypto or thematic bets | High-volatility portfolios with similar drawdown tolerance | Confusing recent momentum with durable edge |
| Speculative | Pursue asymmetric payoffs | Early-stage ideas, options, leverage, microcaps or highly volatile crypto | Other speculative sleeves, not core portfolios | Position sizing that can permanently damage total wealth |
These categories are not recommendations. A conservative investor may still own stocks, and an aggressive investor may still hold cash. The important part is that comparison metrics should change as risk level changes.
Conservative portfolios: compare protection first
For conservative portfolios, the main question is not “who earned the most?” It is “who protected capital while still earning a reasonable return for the environment?”
Cash, short-duration bonds, high-quality bond funds, dividend-focused equities and low-volatility assets can all play a role. But conservative does not mean risk-free. Bond duration can create losses when rates rise. High-yield funds can behave more like equities during stress. Dividend stocks can still fall sharply if the market reprices their sector.
Useful metrics for conservative portfolio comparison include:
- Maximum drawdown over multiple market environments
- Volatility relative to cash and short-term bonds
- Income stability and credit quality
- Duration risk in bond holdings
- Liquidity for expected withdrawals
A conservative portfolio that earns slightly less but avoids forced selling during a downturn may be superior for an investor with near-term cash needs. This is where return rankings can be misleading, especially if the comparison period is a strong bull market.
Balanced portfolios: compare the mix, not the label
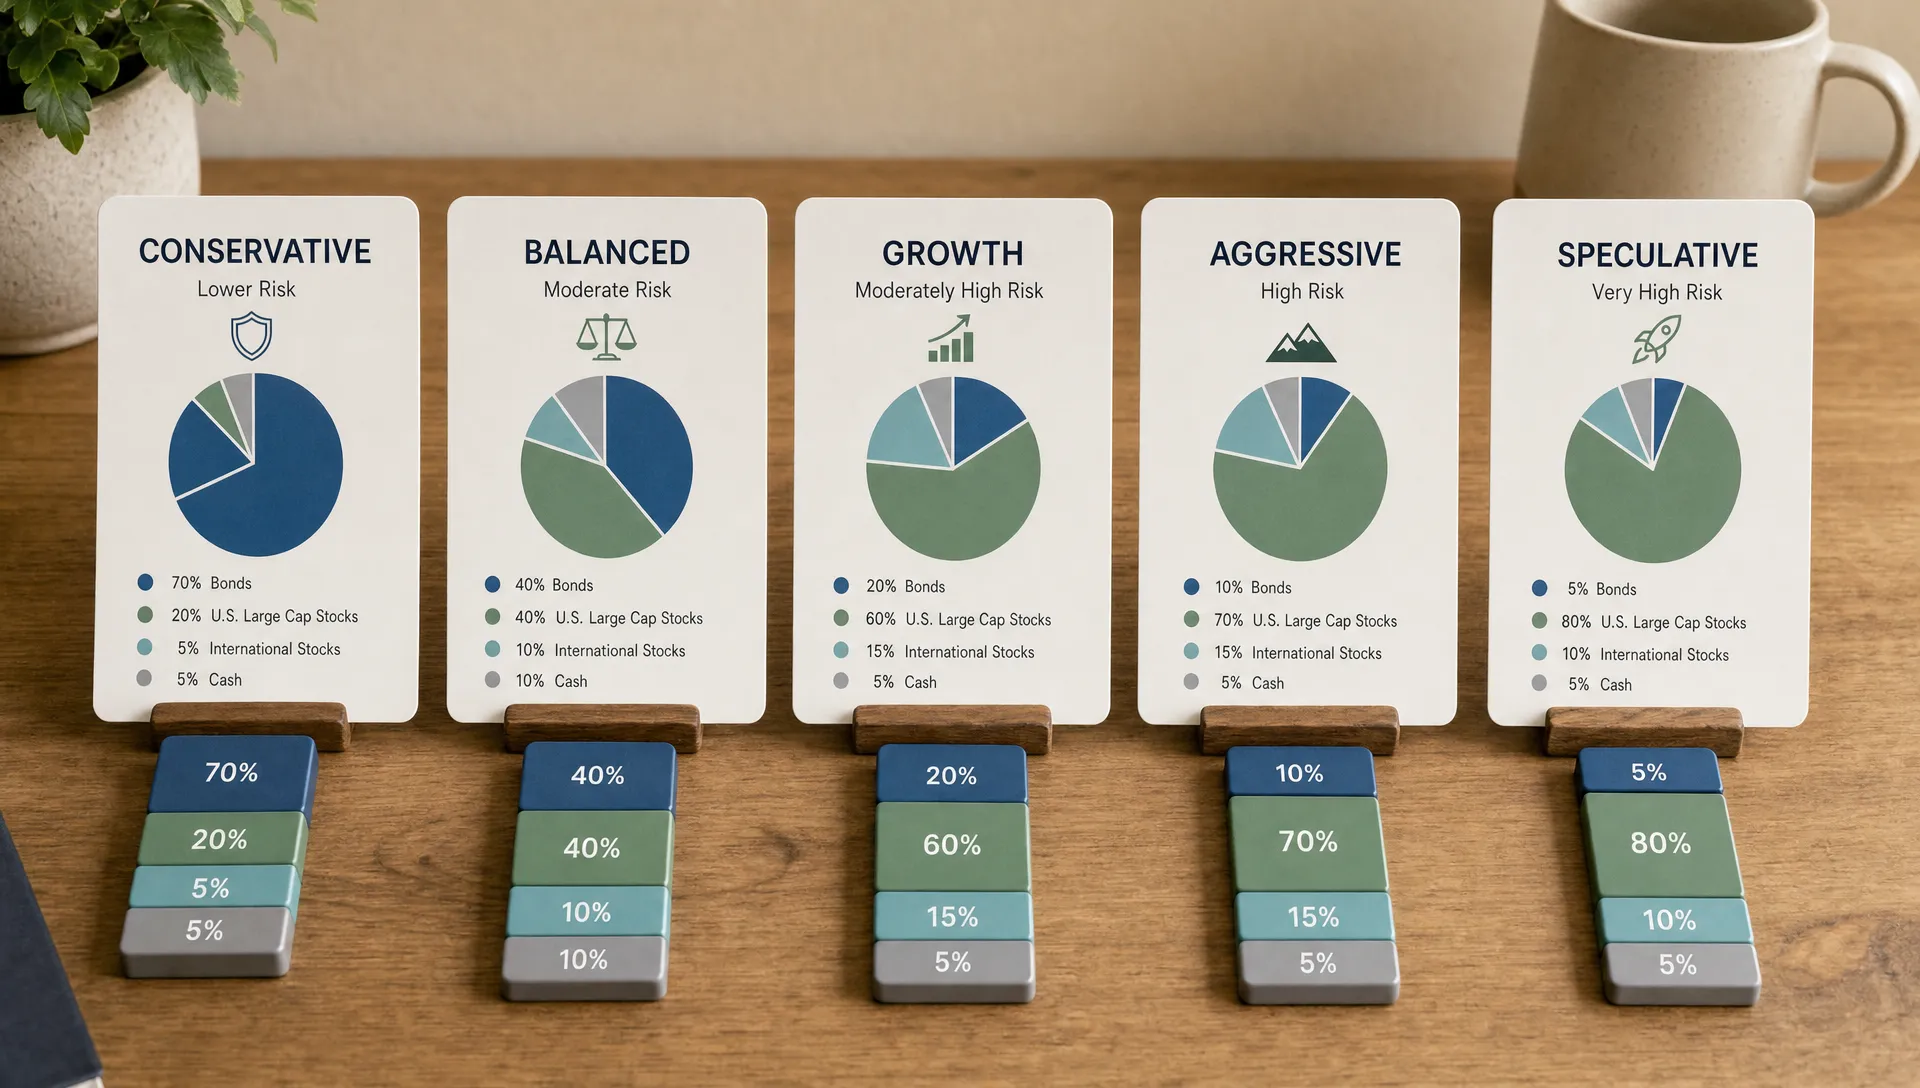
Balanced portfolios often sound simple, but they can hide large differences. Two portfolios may both be described as moderate risk, yet one might hold 60% global equities and high-quality bonds while another holds U.S. mega-cap technology stocks, long-duration bonds and a small crypto sleeve.
The label is the same. The risk profile is not.
Balanced investors should compare allocation, correlation and behavior in different market regimes. How did the portfolio perform when stocks fell? How did it handle rising interest rates? Did bonds diversify equity risk or amplify losses because duration was too high?
A balanced comparison should also look at overlap. Investors often own several ETFs or mutual funds that look diversified on the surface but hold many of the same large companies underneath. If you want to dig deeper into that issue, Upside Invest covers how to compare funds overlap without missing risk.
Growth portfolios: compare durability of compounding
Growth portfolios are built for long horizons, so short-term volatility matters less than the source and durability of returns. A growth portfolio that outperformed because it was heavily exposed to one winning sector is different from one that outperformed through broader stock selection, disciplined rebalancing or diversified factor exposure.
When comparing growth portfolios, ask what actually drove performance. Was it U.S. large-cap exposure? Artificial intelligence stocks? A small-cap rebound? International diversification? A few individual holdings? The answer matters because the same driver may not repeat.
For growth investors, useful metrics include risk-adjusted return, beta, sector concentration, geographic exposure, downside capture and rolling performance across different time windows. Rolling periods are especially helpful because they reduce the temptation to judge a strategy by one start date and one end date.
Growth portfolios should also be compared against a benchmark that fits the actual holdings. A portfolio that is 90% equities should not be judged against a 60/40 stock-bond mix unless the goal is to measure how much extra risk it took. If you need a cleaner method, this guide on how to compare portfolio performance to a benchmark without bias explains how to avoid common benchmark mistakes.
Aggressive and speculative portfolios: compare survival as much as upside
Aggressive portfolios can create impressive gains, but they also need risk controls. A concentrated portfolio that compounds at a high rate for several years can still suffer permanent damage if one position, one theme or one leverage decision goes wrong.
For aggressive investors, the comparison should include upside participation and downside survival. How much of the portfolio is in the top five holdings? What happens if the largest position falls 50%? Are the holdings liquid enough to exit during stress? Is the investor using leverage, options or highly correlated assets that all depend on the same market narrative?
Speculative investments should usually be compared as a sleeve, not as the entire portfolio. For example, a 5% crypto or options sleeve can be evaluated by its contribution to total portfolio return and total portfolio risk. Comparing that sleeve directly to a diversified retirement portfolio creates noise instead of insight.
Risk comparison is also a constraint problem. A traveler does not pack based only on the most lenient airport rule in an itinerary. They may first check the strictest cabin liquid rule for a trip because the most restrictive point can determine what is allowed. Portfolios work the same way: the harshest constraint, such as liquidity needs, margin risk, taxes or emotional tolerance, should shape the comparison.
Metrics that matter at each risk level
No single metric works for every portfolio. Sharpe ratio can be useful, but it is backward-looking and sensitive to the chosen period. Maximum drawdown is important, but it does not tell you whether a portfolio recovered quickly or stayed impaired. Volatility helps, but it treats upside and downside movement similarly.
Use a small set of metrics that fit the portfolio’s purpose.
| Portfolio type | Primary comparison metrics | Secondary checks |
|---|---|---|
| Conservative | Max drawdown, liquidity, income stability, duration | Credit quality, inflation exposure, cash drag |
| Balanced | Asset allocation, volatility, correlation, Sharpe ratio | Fund overlap, rebalancing discipline, downside capture |
| Growth | Rolling returns, beta, sector exposure, drawdown recovery | Geographic mix, valuation sensitivity, factor tilts |
| Aggressive | Concentration, position-level drawdown, upside capture | Liquidity, leverage, correlation across bets |
| Speculative | Position sizing, payoff asymmetry, total portfolio impact | Exit rules, tax impact, probability of permanent loss |
The goal is not to build the most complicated dashboard. The goal is to select metrics that answer the investor’s actual question. A retiree may care more about drawdown and withdrawals. A young investor may care more about whether underperformance is temporary or caused by a broken thesis. A high-income investor with taxable accounts may need to compare after-tax outcomes, not just headline returns.
Compare holdings, not just categories
Asset allocation is the first layer. Holdings are the second. A portfolio that says “40% ETFs” tells you very little until you know what those ETFs own. A portfolio that says “20% technology” may still have more effective technology exposure if its broad-market funds are also dominated by tech-heavy companies.
This matters across all risk levels. Conservative investors may think they are diversified because they own several bond funds, only to discover all of them are sensitive to the same interest rate move. Growth investors may own several funds that all hold the same mega-cap stocks. Aggressive investors may own different tickers that are all tied to the same theme, such as semiconductors, crypto liquidity or consumer discretionary spending.
A better comparison looks through the wrapper and asks:
- Which companies, funds, sectors and themes actually drive the portfolio?
- How much of the portfolio depends on the top 10 holdings?
- Are different assets likely to fall together in the same scenario?
- Does the portfolio rely on one macro outcome, such as falling rates or strong risk appetite?
This is where verified holdings can be more useful than opinions. Seeing what investors actually own, rather than what they say they believe, gives a cleaner view of risk behavior.
Use peer comparison carefully
Peer comparison can be powerful, especially when you compare yourself with investors who have similar risk levels. It can reveal that you are more concentrated than you thought, less diversified than peers or taking a very different sector view from investors with stronger risk-adjusted performance.
But peer comparison can also become performance chasing. If top performers recently benefited from a hot theme, copying them without understanding their risk capacity can be dangerous. The question is not “what are the best investors buying?” The better question is “which investors with a similar risk profile are making decisions I can learn from?”
Upside Invest is built around this distinction. It helps users compare portfolios with verified investor holdings, anonymous profiles, portfolio comparison tools, return and Sharpe metrics, trend tracking and top performer rankings. For a deeper look at this approach, see how Upside Invest helps you benchmark your portfolio against verified investors instead of relying only on broad indexes.
A practical framework for comparing different risk levels
When comparing portfolios across risk levels, do not ask which one is universally better. Ask which one is better for a specific investor, objective and constraint.
Start by assigning each portfolio a risk category based on actual holdings and behavior, not the name of the strategy. Then compare it against portfolios in the same category. After that, compare across categories only to understand trade-offs. A balanced portfolio may underperform an aggressive portfolio in a bull market, but that does not mean it is worse if it delivers the needed return with lower drawdown.
A useful comparison process looks like this:
- Define the investor’s goal, time horizon and liquidity needs
- Identify the portfolio’s real risk level from holdings and exposures
- Choose a fair benchmark and peer group
- Compare returns over multiple rolling periods
- Review drawdown, volatility, concentration and correlation
- Check whether the portfolio’s behavior matches the investor’s ability to stay invested
The final step is the most personal. A mathematically strong portfolio can still be wrong if the investor cannot hold it. A lower-returning portfolio can be better if it keeps the investor disciplined and aligned with the plan.
Common mistakes in investment portfolio comparison
The biggest mistake is ranking portfolios by recent return without adjusting for risk. In a strong market, the highest-risk portfolio often looks smartest. In a downturn, the same portfolio may reveal risks that were always there.
Another mistake is comparing portfolios over a period that favors one style. A growth portfolio may look unbeatable during a technology-led rally. A conservative portfolio may look impressive during a bear market. Neither snapshot tells the full story.
Investors also underestimate concentration. Owning 20 funds does not guarantee diversification. If those funds overlap heavily or respond to the same market drivers, the portfolio may behave like a much narrower bet.
Finally, many comparisons ignore taxes, fees and liquidity. A strategy that looks attractive before taxes may be less compelling after frequent trading. A high-return private or illiquid asset may not serve an investor who needs cash during market stress.
Frequently Asked Questions
What is investment portfolio comparison? Investment portfolio comparison is the process of evaluating portfolios side by side using allocation, holdings, risk metrics, returns, benchmarks and investor goals. The most useful comparisons adjust for risk level rather than ranking portfolios only by performance.
How do I know my portfolio risk level? Look at your stock and bond mix, cash needs, concentration, volatility, drawdowns, leverage, liquidity and exposure to high-risk assets such as speculative stocks or crypto. Your emotional reaction to losses also matters because it affects whether you can stay invested.
Should conservative and aggressive portfolios be compared directly? They can be compared to understand trade-offs, but they should not be ranked as if they serve the same goal. Conservative portfolios should be judged more on capital protection and liquidity, while aggressive portfolios should be judged on upside, concentration and drawdown survival.
Is Sharpe ratio enough to compare portfolios? No. Sharpe ratio is useful because it relates return to volatility, but it is backward-looking and depends on the time period. It should be used with drawdown, concentration, benchmark fit, liquidity and qualitative context.
How often should I compare my portfolio? A quarterly or semiannual review is enough for many long-term investors. More frequent checks can be useful for active strategies, but daily comparison often encourages unnecessary trading unless the portfolio is designed for short-term moves.
Compare risk levels with better context
A good investment portfolio comparison does not crown one portfolio as the universal winner. It shows whether a portfolio is taking the right kind of risk for its purpose.
If you want to see how your allocations, holdings and performance compare with verified investors while keeping your profile private, Upside Invest gives you a more practical way to benchmark decisions. Use peer data as context, not as a shortcut, and focus on building a portfolio whose risk level you can actually hold through the next full market cycle.