Trend Following Indicators That Confirm a Durable Move
A strong move is easy to see after the fact. The harder job is deciding whether the move has enough evidence behind it to keep respecting it, or whether it is only a fast rotation that will fade once early buyers take profits.
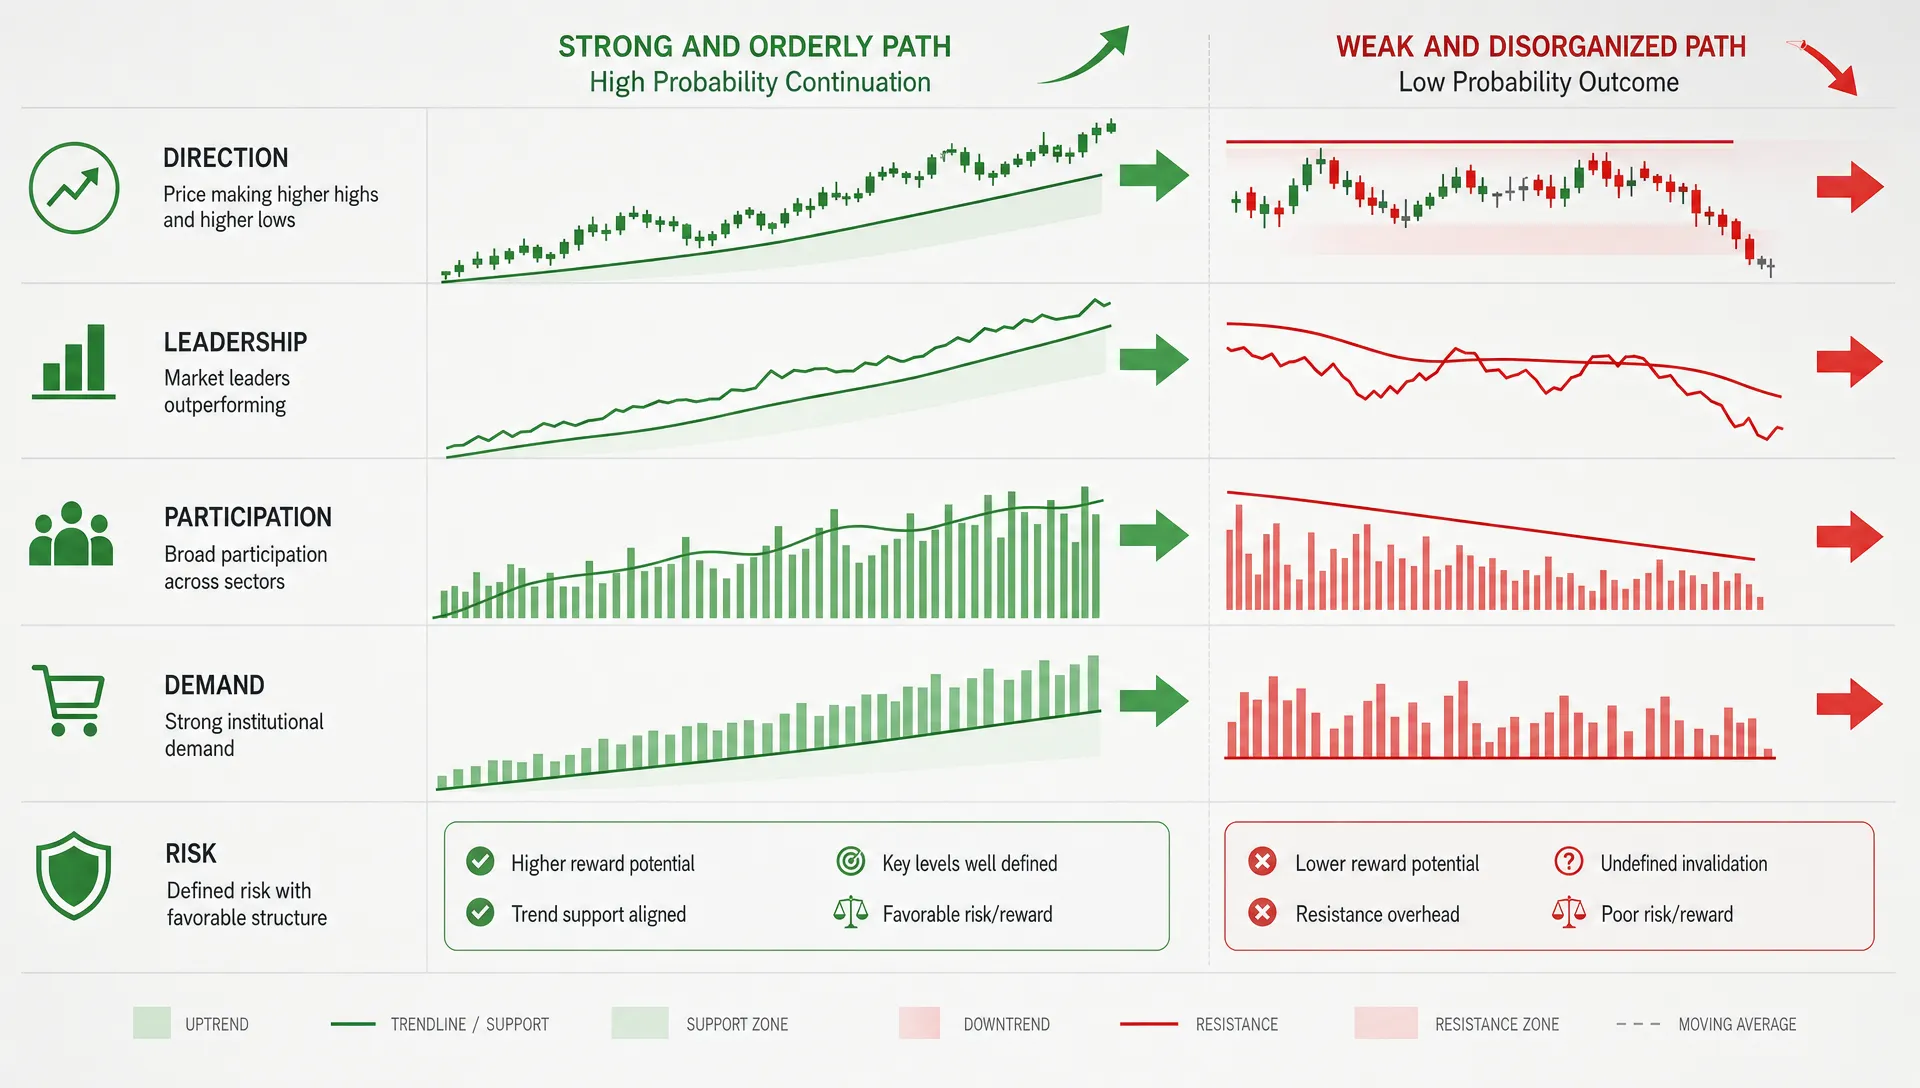
That is where trend following indicators are useful. They do not predict the future with certainty, and they should not be treated as a voting machine where more signals automatically mean a better trade. Their value is in confirmation. A durable move tends to show persistence across price structure, relative strength, participation, demand and risk behavior.
If you already use common tools such as moving averages, breakouts or momentum oscillators, this guide takes the next step: how to tell whether those signals are confirming a move that can last. For a broader overview of the basic tools, Upside has a separate guide to technical trend indicators traders actually use. Here, the focus is durability.
What Makes a Trend Durable?
A durable trend is not just an asset going up. It is a move where buyers repeatedly absorb supply, pullbacks stay controlled and the asset keeps outperforming reasonable alternatives.
For a stock, that might mean it continues making higher highs and higher lows while outperforming its sector. For an ETF, it might mean price holds above a rising long-term average while breadth improves inside the underlying holdings. For crypto, it might mean momentum persists across multiple timeframes instead of depending on one liquidation-driven spike.
Academic research supports the idea that trends can persist across markets. Moskowitz, Ooi and Pedersen documented time-series momentum across major asset classes in their paper Time Series Momentum. The practical lesson is not that every breakout works. It is that persistence can be real, but only when the evidence is strong enough to separate a developing trend from noise.
A useful confirmation process asks three questions:
- Is the asset trending on more than one timeframe?
- Is it outperforming relevant alternatives?
- Is the move supported by demand, participation and controlled risk?
The best trend followers are not looking for certainty. They are looking for alignment.
The Indicator Confirmation Matrix
Before going indicator by indicator, it helps to separate the type of evidence each one provides. Many traders accidentally use five indicators that all measure the same thing. A 20-day moving average, 50-day moving average and MACD may all tell you price has been rising, but they do not necessarily confirm demand, leadership or breadth.
| Confirmation type | Indicator examples | What it helps answer | Durable trend signal |
|---|---|---|---|
| Direction | Moving averages, price structure | Is the asset in an uptrend or downtrend? | Price holds above rising averages and makes higher lows |
| Leadership | Relative strength, ratio charts | Is it outperforming alternatives? | Relative strength line makes new highs with price |
| Participation | Breadth, sector confirmation | Is the move broad or isolated? | Peers, sector or market breadth confirm the move |
| Demand | Volume, accumulation, VWAP | Are buyers supporting the advance? | Breakouts attract volume and dips find demand |
| Trend strength | ADX, momentum persistence | Is the trend gaining structure? | ADX rises with directional alignment |
| Risk behavior | ATR, volatility contraction | Is the trend becoming unstable? | Pullbacks remain orderly relative to volatility |
This measurement-first mindset matters beyond investing too. Growth teams use tools such as CapstonAI's AI visibility platform to verify whether a brand is consistently appearing across AI search engines rather than relying on one ranking snapshot. Investors can borrow the same logic: one signal is interesting, but a durable move needs confirmation from independent sources.
1. Moving Average Slope and Structure
Moving averages are often treated too mechanically. A price above the 200-day moving average is not automatically bullish. A 50-day average crossing above a 200-day average is not automatically a buy signal. The confirmation comes from the structure around those averages.
A more durable trend usually has three qualities. First, the medium-term and long-term averages are both rising. Second, price spends more time above those averages than below them. Third, pullbacks toward the averages attract buyers before the trend breaks down.
The slope matters because it tells you whether the average is reflecting persistent accumulation or just a sideways range. A flat 200-day moving average can produce repeated whipsaws because price is crossing an equilibrium line, not trending away from it.
A simple framework is to use a long-term moving average as the regime filter and a shorter moving average as the trend management tool. For example, an investor might only consider long setups when price is above a rising 200-day average, then monitor the 50-day average for pullbacks, rebounds and early deterioration. The exact settings matter less than consistency.
Durability improves when moving averages are stacked in the right order. In an uptrend, shorter averages sit above longer averages and all of them slope higher. In a downtrend, the reverse is true. Choppy overlap is a warning that the move may not yet be durable.
2. Relative Strength Versus a Real Benchmark
Relative strength is one of the cleanest ways to confirm whether a move deserves attention. A stock can rise because the entire market is rising. A durable leader rises more than its benchmark, and often keeps outperforming during shallow market pullbacks.
The benchmark should match the decision you are making. If you are evaluating a large-cap technology stock, compare it with the Nasdaq 100, the S&P 500 and its sector ETF. If you are evaluating a regional bank, comparing it only with the S&P 500 might hide what is happening inside financials. For crypto, relative strength might mean comparing an asset with bitcoin, ether or a broad crypto index.
A relative strength line is simple: divide the asset price by the benchmark price. If the line is rising, the asset is outperforming. If price breaks out but the relative strength line does not, the breakout may be less compelling.
The strongest confirmation often appears when price and relative strength make highs together. That says the asset is not only going up, it is becoming more attractive than the alternatives available to capital at that moment.
This is especially useful in crowded markets. When many stocks are moving together, relative strength helps identify which names institutions, skilled investors or persistent buyers may be favoring. Upside's guide on how to spot trending trades before the crowd explains how ownership data and price action can work together when a trend is still developing.
3. Breakouts With Follow-Through
A breakout is a potential start, not a completed confirmation. Many failed moves begin with a clean push above resistance. The difference is what happens next.
A more durable breakout usually shows follow-through. Price closes above the range, avoids immediately falling back below the breakout level and attracts additional buying over the next several sessions or weeks. In longer-term investing, the weekly close can be more useful than the intraday high because it filters out short-lived spikes.
Volume can help, but it should be interpreted carefully. A breakout on strong volume suggests demand is active. A breakout on weak volume can still work, especially in less liquid assets, but it deserves more confirmation from price behavior and relative strength.
The retest is another useful clue. If former resistance becomes support and buyers defend that area, the market is showing that prior sellers have been absorbed. If price breaks out then quickly loses the level on heavy selling, the trend may still exist, but the breakout itself has failed as an entry signal.
Failed breakouts are valuable information. They tell you where expectations were high and where buyers stopped defending the move. Trend followers do not need to fight that evidence. They can wait for a cleaner setup or reduce risk when the original confirmation disappears.
4. ADX and Directional Movement
The Average Directional Index, or ADX, measures trend strength, not direction. That distinction matters. A rising ADX can confirm that a trend is becoming more persistent, but you need directional movement to know whether the strength favors buyers or sellers.
Many traders look for ADX moving above the 20 to 25 area as a sign that a market is leaving a range and beginning to trend. The number is not magic. What matters is whether ADX is rising while price structure and directional movement agree.
In an uptrend, a stronger confirmation occurs when +DI is above -DI, price is above key moving averages and ADX is rising from a low level. That combination suggests the move is gaining structure after a period of compression or indecision.
ADX is often late by design. It confirms that a trend has already shown persistence. That makes it useful for conviction and risk management, but less useful as the first entry signal. If ADX is very high after a vertical move, the trend may be strong, but the near-term reward-to-risk can be less attractive because the asset may be extended.
5. Volume, Accumulation and Anchored VWAP
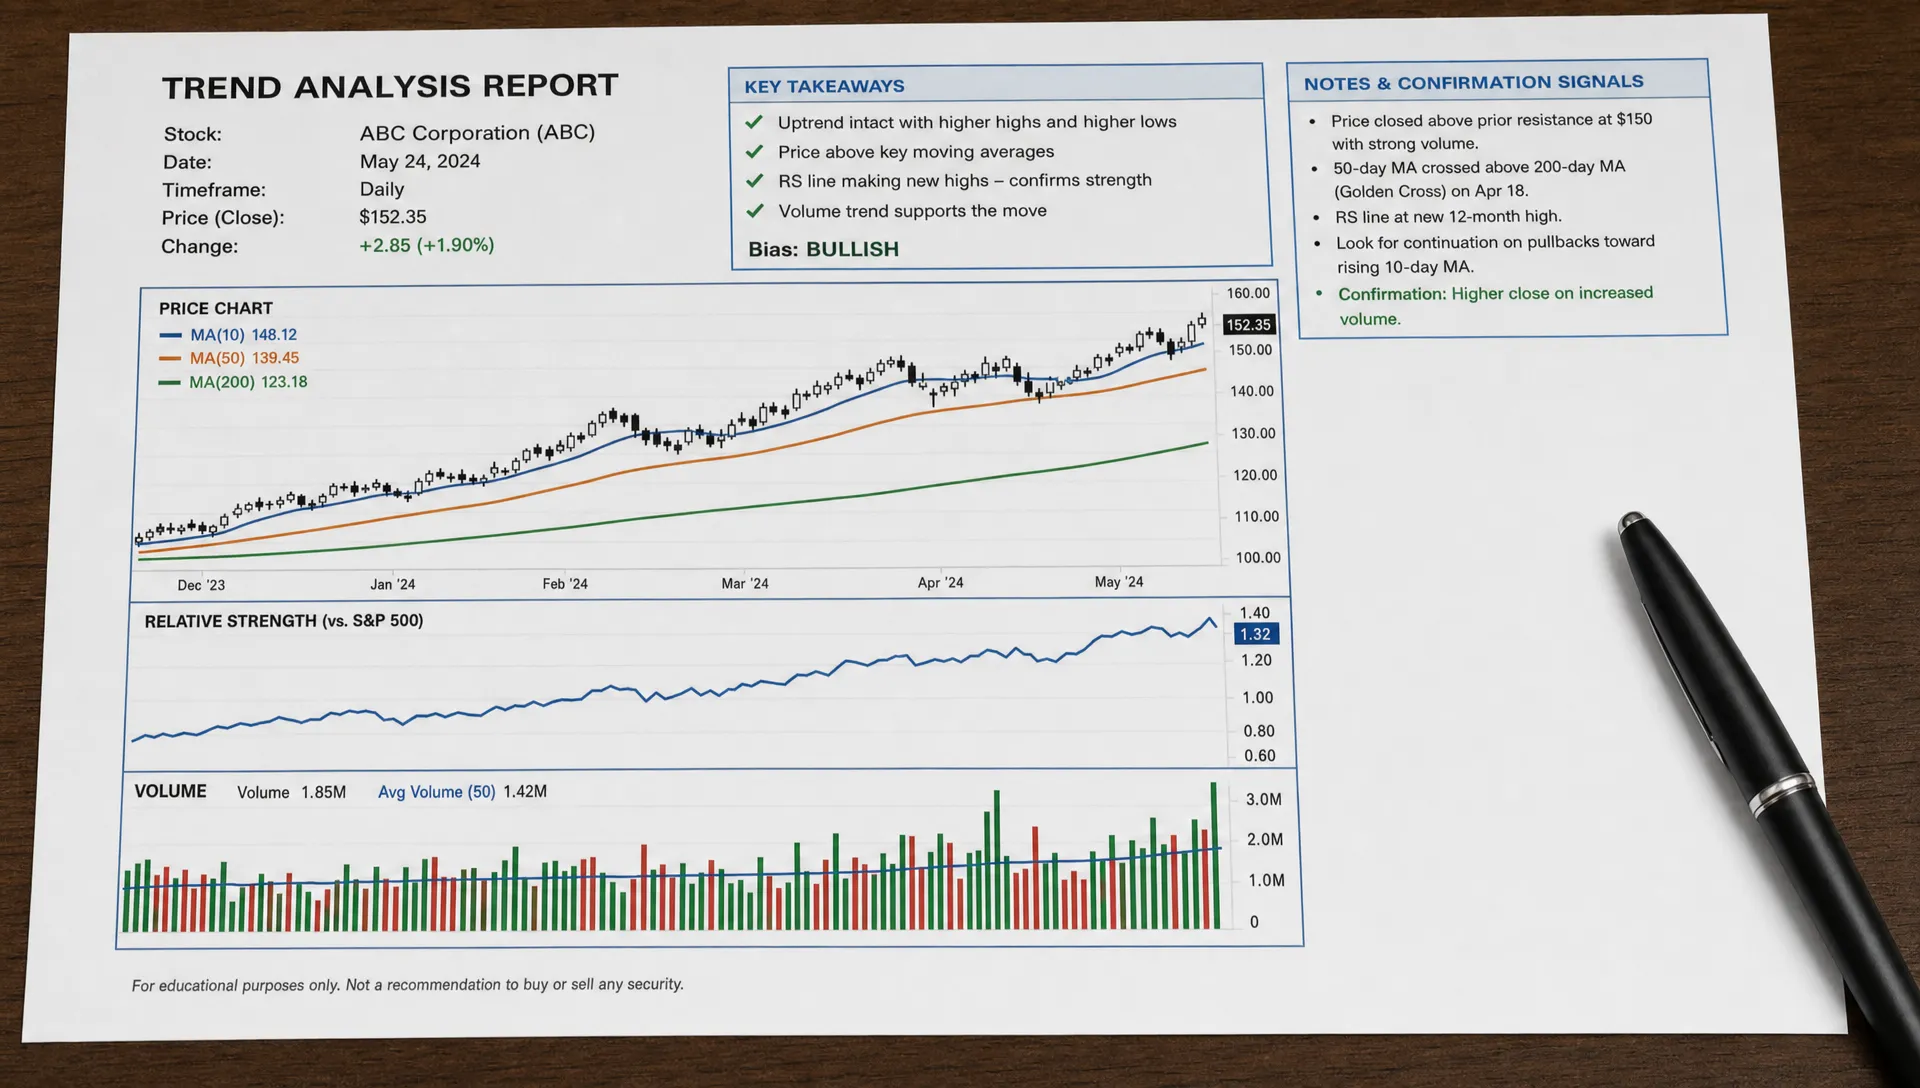
Volume helps answer a different question than price: how much participation occurred during the move?
In a durable advance, up days often show stronger volume than down days, breakouts attract participation and pullbacks occur on quieter selling. This pattern suggests buyers are more aggressive than sellers. It does not guarantee continuation, but it supports the idea that demand is real.
On-balance volume, accumulation-distribution lines and volume by price can all help, but the goal is simple: identify whether volume confirms or contradicts the price trend. If price makes new highs while volume-based measures lag badly, the move may still work, but it deserves closer scrutiny.
Anchored VWAP can also be useful. By anchoring VWAP to a meaningful event, such as an earnings gap, major low, breakout or market shock, investors can see whether buyers since that event are broadly in profit. If price repeatedly holds above an anchored VWAP from an important low, it suggests the move has a supportive cost basis. If price loses that level and cannot reclaim it, the trend may be weakening.
For retail investors, volume signals are most useful when paired with price levels. A high-volume breakout above a long base is more meaningful than a random high-volume day in the middle of a range.
6. Volatility and ATR Behavior
A durable trend does not move in a straight line. It expands, pauses, digests gains then tries to continue. Volatility indicators help distinguish healthy digestion from disorderly selling.
Average True Range, or ATR, measures how much an asset typically moves over a given period. Trend followers often use ATR to set position sizes or trailing stops because it adapts to the asset's own volatility. A $5 stop might be wide for one stock and meaningless for another.
In a healthy uptrend, volatility can expand during the impulse move then contract during the pullback. That contraction suggests selling pressure is not overwhelming the prior advance. If ATR spikes while price breaks below support, the move may be shifting from normal pullback to trend damage.
ATR is also useful for avoiding crowded entries. If price is far above its moving averages and has already moved several ATRs without a pause, the trend may be real but tactically stretched. Durable trends usually offer multiple entries over time. Chasing the most extended point can turn a good thesis into a poor trade.
For a deeper risk-management angle, Upside's guide to technical trend trading rules for managing risk covers invalidation, stop placement and position sizing in more detail.
7. Breadth and Participation
Breadth tells you whether a trend is being carried by a few names or supported by a wider group. For indexes, common breadth indicators include the percentage of stocks above their 50-day or 200-day moving average, advance-decline lines and new highs versus new lows.
For individual stocks, breadth can be translated into peer confirmation. If one semiconductor stock is breaking out while the rest of the group is deteriorating, the stock may still be a leader, but the setup has less sector support. If multiple high-quality peers are also trending higher, the move has a stronger foundation.
Breadth matters because durable trends often attract capital at the theme or sector level. A single stock can lead first, but if the theme is real, related assets often begin to confirm. That does not mean every stock in the group should be bought. It means participation can help validate whether capital is rotating into the space.
Weak breadth is not an automatic sell signal. Some of the best market leaders outperform before the rest of the group catches up. The warning appears when price keeps rising but breadth deteriorates, fewer peers confirm and relative strength starts to roll over. At that point, the trend may be narrowing.
8. Multi-Timeframe Agreement
A daily chart can make a move look powerful while the weekly chart still shows a stock trapped under long-term resistance. A five-minute chart can look bullish while the daily trend remains broken. Durable moves are easier to trust when multiple timeframes agree.
For investors, the weekly chart is often the primary trend map. It filters noise and shows whether the asset is building a larger base, breaking out of a long range or merely bouncing inside a downtrend. The daily chart can then help with entries, pullbacks and invalidation levels.
A practical sequence is to start with the higher timeframe, then move lower. If the weekly trend is rising, the daily chart can be used to find controlled pullbacks or breakouts. If the weekly trend is falling, a daily rally needs extra confirmation before it qualifies as a durable move.
This avoids one of the most common mistakes in trend following: mistaking a countertrend bounce for a new trend. A bounce can be profitable, but it requires a different playbook than a durable move.
9. Verified Investor Behavior as a Confirmation Layer
Charts show what price has done. Portfolio behavior can add context about what verified investors are actually holding, adding or avoiding.
This is where platforms such as Upside Invest can complement technical confirmation. Upside shows anonymous verified investor holdings, portfolio comparisons, top performer rankings, return and Sharpe metrics, trend tracking and alerts on investor moves. Used carefully, that data can help answer whether a trend is attracting persistent ownership from investors with strong records or whether it is mostly a short-lived price move.
This layer should not replace your own analysis. A popular holding can still be overextended, and a top performer can be early or wrong. But when price trend, relative strength and verified portfolio behavior all point in the same direction, the move has more independent confirmation than a chart alone can provide.
The opposite is also useful. If a stock is breaking out but verified investors with strong historical metrics are not participating, or if ownership appears to be fading during the move, that does not automatically invalidate the trend. It does tell you to demand stronger evidence elsewhere.
How to Combine Trend Following Indicators Without Overfitting
The biggest mistake is adding indicators until the chart says what you want it to say. A cleaner approach is to choose one or two indicators from each evidence category.
| Evidence category | Primary tool | Secondary confirmation | What would weaken the signal? |
|---|---|---|---|
| Trend direction | Rising 200-day moving average | Higher highs and higher lows | Price closes below key support repeatedly |
| Leadership | Relative strength line | Sector-relative performance | Price rises but underperforms peers |
| Demand | Breakout volume | Anchored VWAP support | Breakout fails on heavy selling |
| Participation | Sector breadth | Peer confirmation | Fewer names participate over time |
| Risk behavior | ATR-based stop | Volatility contraction on pullbacks | Volatility expands sharply on declines |
| Investor behavior | Verified holdings trends | Top performer exposure | Ownership fades as price extends |
This kind of framework prevents redundancy. You do not need four momentum oscillators saying the same thing. You need a balanced view of direction, leadership, participation, demand and risk.
It also helps to define invalidation before entering. A durable trend can survive normal pullbacks, but it should not survive every possible decline in your process. If your thesis depends on price holding a breakout level, losing that level matters. If your thesis depends on relative strength, underperformance matters. If your thesis depends on broad participation, narrowing leadership matters.
For investors building a full ruleset, Upside's article on trend following strategies that still work in 2026 offers a broader strategy perspective.
A Practical Durable Trend Checklist
Use this as a decision filter, not a guarantee. The more items that align, the stronger the confirmation.
- Price is above a rising long-term moving average.
- The asset is making higher highs and higher lows on the relevant timeframe.
- Relative strength is rising versus the right benchmark.
- Breakouts show follow-through instead of immediate failure.
- Pullbacks occur on controlled volatility and hold logical support.
- Volume or accumulation confirms demand.
- Sector, peer or market breadth supports the move.
- Verified investor behavior does not contradict the trend.
- There is a clear invalidation level before entering.
If only one or two items are true, you may be looking at an early move, a tradeable bounce or a false breakout. If most are true, the trend is not risk-free, but it is better confirmed.
Frequently Asked Questions
What are the best trend following indicators for confirming a durable move? The most useful indicators are moving average slope, relative strength, breakouts with follow-through, ADX, volume, breadth, ATR and multi-timeframe structure. The best choice depends on whether you need to confirm direction, leadership, participation, demand or risk.
Is a moving average crossover enough to confirm a trend? No. A crossover can help identify a changing regime, but it is stronger when the moving averages are rising, price holds above them, relative strength improves and pullbacks remain controlled.
How do I avoid false breakouts? Look for follow-through after the breakout, stronger relative strength, supportive volume and a successful retest of the breakout zone. If price quickly falls back into the prior range on heavy selling, the breakout signal has weakened.
Can trend following indicators work for long-term investors? Yes, but long-term investors usually benefit from slower settings and higher timeframes. Weekly charts, 100-day or 200-day moving averages, 6-month to 12-month relative strength and broader participation signals can reduce noise.
Should I use investor holdings data with technical indicators? Holdings data can add a behavioral layer. If verified investors with strong records are building exposure while price and relative strength confirm the move, the trend may have stronger support. It should still be paired with risk controls.
Turn Trend Confirmation Into a Repeatable Process
Durable moves are built on alignment. Price should confirm direction, relative strength should confirm leadership, breadth should confirm participation and risk indicators should show that pullbacks remain manageable.
Upside Invest helps retail investors add another layer to that process by showing what verified investors are buying, holding and outperforming with. You can compare your portfolio, monitor trend and momentum data, review top performer behavior and use anonymous benchmarking to make more informed decisions.
Use indicators to define the trend, then use real portfolio data to test whether other verified investors are acting in ways that support or challenge your view. That combination will not remove risk, but it can make your trend following process more disciplined, evidence-based and repeatable.